Lewis and Curry: Climate sensitivity uncertainty

by Judith Curry

Our new paper on climate sensitivity is now published.

Nicholas Lewis and Judith Curry:  The implications for climate sensitivity of AR5 forcing and heat uptake estimates.  Climate Dynamics, September 2014 [link]

Nic Lewis has posted a link to the full paper [here], along with data and code.

Context

Some context is provided, excerpted from my recent Congressional testimony:

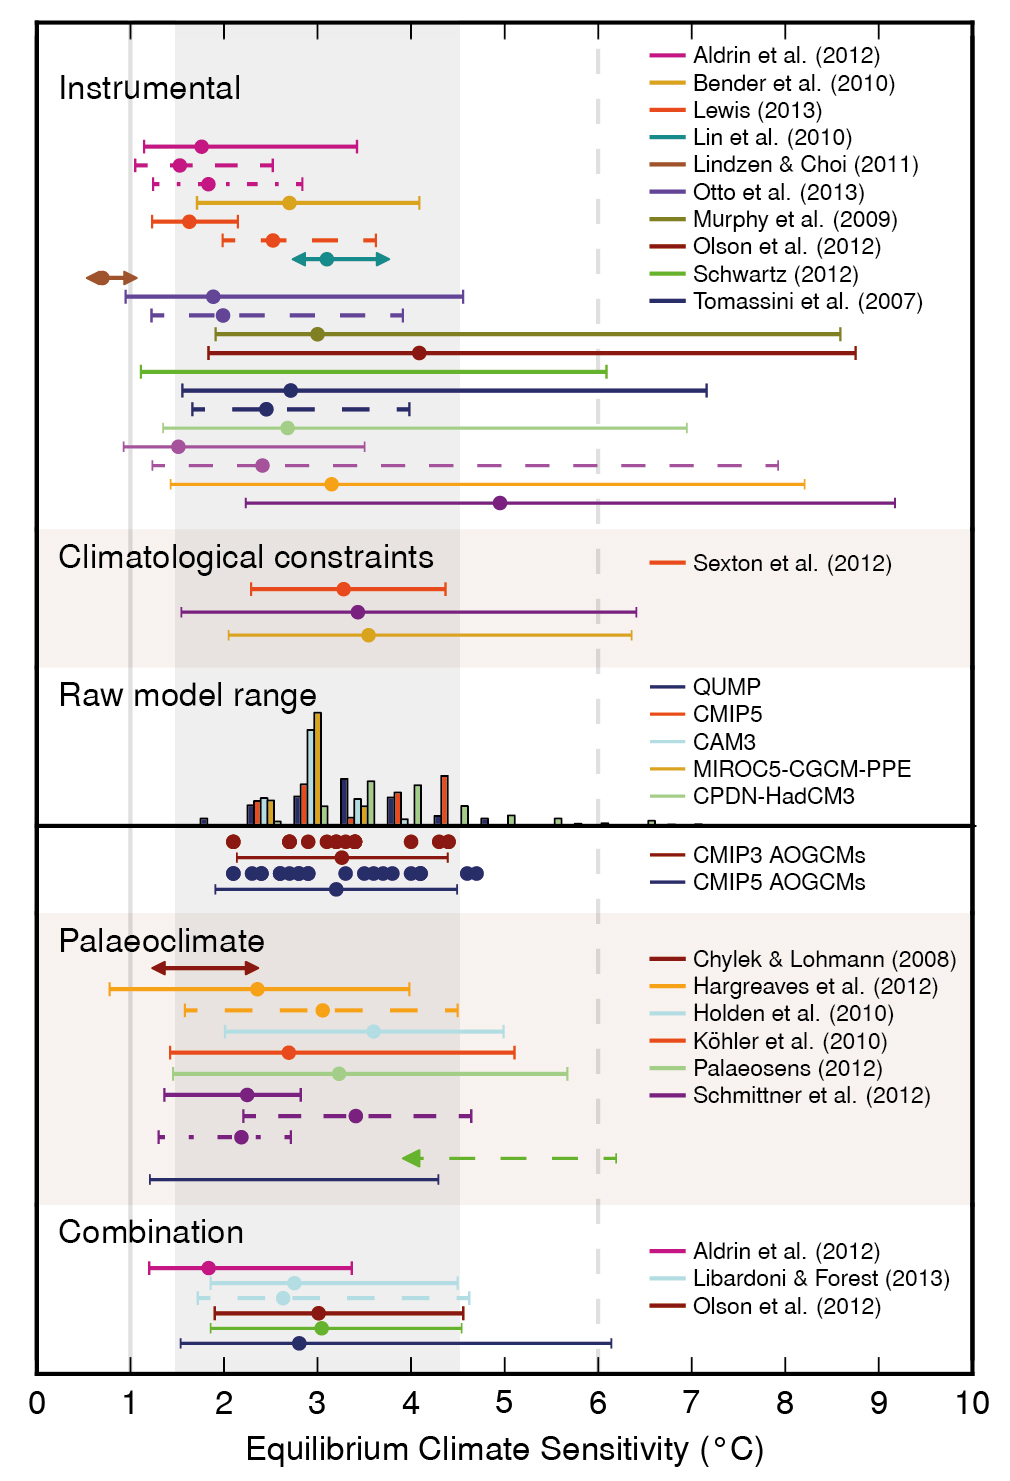
The sensitivity of our climate to increasing concentrations of carbon dioxide is at the heart of the scientific debate on anthropogenic climate change, and also the public debate on the appropriate policy response to increasing carbon dioxide in the atmosphere. Climate sensitivity and estimates of its uncertainty is a key input into the economic models that drive cost-benefit analyses and estimates of the social cost of carbon.

One of the most significant outcomes of the recent IPCC Fifth Assessment Report is the change in conclusions relative to the Fourth Assessment Report. The equilibrium climate sensitivity (ECS) is defined as the change in global mean surface temperature at equilibrium that is caused by a doubling of the atmospheric CO2 concentration. The IPCC AR4 conclusion on climate sensitivity is stated as:

“The equilibrium climate sensitivity. . . is likely to be in the range 2oC to 4.5C with a best estimate of about 3oC and is very unlikely to be less than 1.5C. Values higher than 4.5oC cannot be excluded.” (AR4 SPM)

The IPCC AR5 conclusion on climate sensitivity is stated as:

Equilibrium climate sensitivity is likely in the range 1.5°C to 4.5°C (high confidence), extremely unlikely less than 1°C (high confidence), and very unlikely greater than 6°C (medium confidence) (AR5 SPM)

The bottom of the ‘likely’ range has been lowered from 2 to 1.5C in the AR5, whereas the AR4 stated that ECS is very unlikely to be less than 1.5C. It is also significant that the AR5 does not cite a best estimate, whereas the AR4 cites a best estimate of 3C. Further the AR5 finds values of ECS exceeding 6C to be very unlikely, whereas the AR4 did not have sufficient confidence to identify an upper bound at this confidence level. The stated reason for not citing a best estimate in the AR5 is the substantial discrepancy between observation-based estimates of ECS (lower), versus estimates from climate models (higher).

Nic Lewis’ blog post

Here are excerpts from Nic Lewis’ blog post at ClimateAudit on the paper:

When the Lewis & Crok report “A Sensitive Matter” about how the IPCC Fifth Assessment Working Group 1 report (AR5) was published by the GWPF in March, various people criticised it for not being peer-reviewed. But peer review is for research papers, not for lengthy, wide-ranging review reports. The Lewis & Crok report placed considerable weight on energy budget sensitivity estimates based on the carefully considered AR5 forcing and heat uptake data, but those had been published too recently for any peer reviewed sensitivity estimates based on them to exist.

I am very pleased to say that the position has now changed. Lewis N and Curry J A: The implications for climate sensitivity of AR5 forcing and heat uptake estimates, Climate Dynamics (2014), has just been published. The paper’s results show the best (median) estimates and ‘likely’ (17–83% probability) ranges for equilibrium/effective climate sensitivity (ECS) and transient climate response (TCR) given in the Lewis & Crok report to have been conservative.

Our paper derives ECS and TCR estimates using the AR5 forcing and heat uptake estimates and uncertainty ranges. The analysis uses a global energy budget model that links ECS and TCR to changes in global mean surface temperature (GMST), radiative forcing and the rate of ocean heat uptake between a base and a final period. The resulting estimates are less dependent on global climate models and allow more realistically for forcing uncertainties than similar estimates such as those from the Otto et al (2013) paper.

Base and final periods were selected that have well matched volcanic activity and influence from internal variability, and reasonable agreement between ocean heat content datasets. The preferred pairing is 1859–1882 with 1995–2011, the longest early and late periods free of significant volcanic activity, which provide the largest change in forcing and hence the narrowest uncertainty ranges.

Table 1 gives the ECS and TCR estimates for the four base period – final period combinations used.

Slide1Table 1: Best estimates are medians (50% probability points). Ranges are to the nearest 0.05°C

AR5 does not give a 95% bound for ECS, but its 90% bound of 6°C is double that of 3.0°C for our study, based on the preferred 1859–1882 and 1995–2011 periods.

Considerable care was taken to allow for all relevant uncertainties. One reviewer applauded “the very thorough analysis that has been done and the attempt at clearly and carefully accounting for uncertainties”, whilst another commented that the paper provides “a state of the art update of the energy balance estimates including a comprehensive treatment of the AR5 data and assessments”.

There is thus now solid peer-reviewed evidence showing that the underlying forcing and heat uptake estimates in AR5 support narrower ‘likely’ ranges for ECS and TCR with far lower upper limits than per the AR5 observationally-based ‘likely’ ranges of: 2.45°C vs 4.5°C for ECS and 1.8°C vs 2.5°C for TCR. The new energy budget estimates incorporate the extremely wide AR5 aerosol forcing uncertainty range – the dominant contribution to uncertainty in the ECS and TCR estimates – as well as thorough allowance for uncertainty in other forcing components, in heat uptake and surface temperature, and for internal variability. The ‘likely’ ranges they give for ECS and TCR can properly be compared with the AR5 Chapter 10 ‘likely’ ranges that reflect only observationally-based studies, shown in Table 1. The AR5 overall assessment ranges are the same.

The CMP5 GCMs used for AR5 all have ECS values exceeding 2°C, whereas 70% of our preferred main results ECS the probability lies below that level, and over 90% lies below the 3.2°C mean ECS of CMIP5 models. The 33 CMIP5 models with suitable archived data show TCR values exceeding our preferred best estimate of 1.33°C in all but one case, with an average TCR exceeding the top of our 1.8°C ‘likely’ range.

The study does not assume any possible contribution to the increase in GMST from indirect solar influences not allowed for in the AR5 forcing estimates, or from natural internal climate variability affecting ocean heat uptake and/or forcing.

JC remarks

Nic Lewis and I have been discussing the issue of climate sensitivity for some time, and I wrote the foreword to the Lewis and Crok essay published by the GWPF.  Nic invited me to coauthor this paper, and I was delighted to given my concerns about ignoring uncertainties in external forcing in attribution arguments and climate sensitivity estimates (which I discussed in the Uncertainty Monster paper).

One of major reasons for submitting the paper to Climate Dynamics, apart from its relatively high impact factor, is the excellence and fairness of its editorial staff.  The paper did not encounter any major problems in the review process, and one of the reviewers made suggestions that substantially improved the readability of the paper.  I would like to commend the editor, Edwin Schneider, for his excellent service to the community in his position as editor of Climate Dynamics.

One of the most important contributions of this paper is the assessment of uncertainties in external forcing on estimates of climate sensitivity, which is something that has hitherto been only partially allowed for in most climate sensitivity estimates. As pointed out by the AR5 and this paper, the uncertainties in external forcing are substantial, particularly for aerosols.

Is this paper the last word on climate sensitivity estimates? No. The uncertainty analysis in the Lewis and Curry paper relates only to the uncertainty in external forcing, surface temperature and ocean heat uptake. There remains considerable meta uncertainty in the determination of climate sensitivity, including how the problem is even framed.

In particular, the energy balance approach does not account for factors that do not directly relate to the energy balance, e.g. solar indirect effects and natural internal variability that affects forcing (although an attempt has been made in the Lewis and Curry paper to make some allowance for uncertainty associated with these factors) . Further, there was ‘something else’ going on in the latter 19th and early-mid 20th century that was causing warming, that does not seem to relate directly to external forcing. The paper does attempt to factor out the impact of the Atlantic Multidecadal Oscillation through the selection of base and final periods, but this is by no means a complete account for the effects of multi-decadal and century scale internal variability, and how this confounds the energy balance estimate of climate sensitivity.

Resolving the reasons for differences between observational/energy balance estimates and GCM estimates of climate sensitivity is an issue of substantial importance. At this point, I find the estimates in the Lewis and Curry paper to be the most convincing estimates available to date.

Moderation note:  This is a technical thread, comments will be moderated for relevance.

sensitivity cartoon

543 responses to “Lewis and Curry: Climate sensitivity uncertainty

  1. I met Nic Lewis in Bristol yesterday so I will read this with particular interest.

    No, I didn’t go to the Mann Lecture but I did meet Anthony Watts et al.

    He also has the paper up so it might be worth posting a link to it, as no doubt two separate discussions will take place.

    I will read the paper a couple of times before I make any comments

    tonyb

  2. Dr. Curry,
    Congratulations on your paper. The AR4SPM excerpt at the beginning has 20C and 30C, instead of 2.0C and 3.0C. The last paragraph before Nic’s blog post has 60C instead of 6.0C.

  3. Judith, congratulations on this paper. A landmark.
    Way back in 1938 Guy Callendar estimated ‘effective’ sensitivity to be about 1.67. Your much more sophisticated approach says he was about right, and Charney/IPCC AR4 badly wrong.
    Your paper also is an alternative observational falsification of the GCMs. The other being the present length of the pause in light of Santer 2011 (need 17 years) and McKittrick 2014 (16, 19, or 26 years of no observed warming).
    Both are a big deal in the run up to Paris 2015.

    • “Both are a big deal in the run up to Paris 2015.”

      In a sane world, that would be correct. Still, it ain’t good news for the alarmists who it seems, would rather we all fry than be shown to be wrong.

      • pokerguy, I think the politics can be defused if the scientific community can converge on a reasonable range of expected temperature increases.

      • “a reasonable range of expected temperature increases”

        lol Looks good, lets roll.

        When does the science happen?

        Andrew

      • “scientific community”‘

        Almost a quaint notion these days. Cut out the government funding and other powerful inducements toward ever more hysterical alarmism, and we might return to something resembling sanity

      • Don’t forget the Copenhagen Accord. 2 degrees is the goal. If we’re under that, everyone declares victory and goes to find a new hobby. For some, that would be… catastrophic.

      • PG, I usually try to respect the term when posted…”this is a technical thread” and focus on others although in substance that’s a farcical protocol in general. For example, everything “technical” here starts with pie-in-the-sky assumptions with no control or test mechanism. Kinda like the NYTimes editorial board. Everything here is based on assumptions about co2 impact that simply isn’t in evidence…no empirical laws that repeat…no science….all opinions. Sure, in the marginal skeptical world and certainly among the alarmist the Hoo-ha over the AR-5 overstatements etc.etc.;

        http://wattsupwiththat.com/2014/09/24/significant-new-paper-by-nic-lewis-and-judith-curry-lowers-the-range-of-climate-sensitivity-using-data-from-ipcc-ar5/

        The reality is the basic assumptions simply aren’t verifiable science. I’ll leave this thread until of course the greater political question again overshadows the Angel-on-pin-head “technical” topic. I don’t see that discipline lasting a day by the way but out of respect to the host……I’ll exit the thread.

      • Cwon14, you should have read the paper before posting.
        The beauty of it is that it takes AR5 own best estimates for T, Q, and F to compute effective ECS and TCR. And comes out with TCR 1.3 and ECS 1.64. That means, using IPCC AR5 own best, most recent estimates, that there is NO global warming problem and that Paris should be cancelled.
        Let me say it differently. Now we know why AR5 WG1 did not give a best estimate. That estimate falsifies the CMIP5 archive, which averages TCR 1.8 and ECS 3.2. It nullifies any notion of a climate crisis in the next century based on RCP 6 (RCP 8.5 is physically impossible) emissions.

      • Rud,
        All of which will continue to demonstrate that this is not really about the science. Because of course Paris will not be cancelled, nor will Obama come out with a statement that perhaps there’s good new after all on the “climate change” front, nor can we expect any of the usual rogues gallery of establishment climate scientists to step back even slightly. These people are in this thing up to their eyeballs; they can’t go back

        That said, I do believe the policy debate has been over for a long time. They just don’t know it yet. Because when push comes to shove, industrialized nations are simply not going to intentionally impoverish themselves. Simply will not happen.

      • It may be time to move, on some level, beyond mere reason to accomplishments. This is not a sane world and, nope, in climate science, reason is not much important, it is seeming more.

        David Horowitz has a new book, Take No Prisoners, about the silliness of the “reason side” to deal with the explosive “emotional, irrational side.”

        We might think about that. ….Lady in Red

        PS: It is not an arena in which I’d suggest Judith play around….. others?

    • Rud, I get the technical point. If the actual facts were in question it would matter but frankly in the larger sense they don’t. The AGW mission is driven by political ambitions and agenda, you can add this to hundreds of other actual contradictions and science observations the agenda continues. I admit, they look stupid and the pie-chart skeptics will run with it but that long-range tactic hasn’t won the debate because general population really can’t process any level of deception involved.

      My moan is that using IPCC “facts” which in fact aren’t facts at all but assumptions validates (using their own estimates) what should be struck down from inception. So we’re validating IPCC assumptions as we criticize them, a poor practice repeated over and over. I have no doubt the falsified quote was given as much expedient treatment as many of the past IPCC summary policy statements that were created when they kick out all and certainly select scientists and just made things up. Dr. Lindzen reported on that in depth, it hasn’t changed the road to where we are.

      So are you actually shocked they would cook the import numbers to enhance their narrative at the time?? Now the hoo-ha attacking the messengers etc. etc. This could go on for decades more in this fashion.

      Things will actually change when they acknowledge the political affiliations that drive the bad behavior and the public develops a clear understanding, “consensus” if you will on those motives. Yes, another bad act has been exposed and added to the list. I congratulate the authors. When they go on the record as to why the IPCC is corrupt and steers data progress will be made, not before.

      • I understand. You might like portions of the upcoming book ( at the publisher, should be available in about 4 weeks.) Has specific essays doing just what you ask, almost like laying out situations for a jury. Deconstructs most of the AR4/AR5 results, including hidingnthe pause, and sensitivity. Also the temperature record fiddles. And the regional climate extremes nonsense in the 2014 US National Climate Assessment. And the probable scientific misconduct in Marcotts 2013 hockey stick paper, which Science still has not retracted and which Climate.gov now features prominently. And all the past predictions of doom that have already failed. Right down to symbolic polar bears. All bite sized, but not sound bites.
        Is intended precisely for the lay audience (voters) that the other side has been reaching using vast governmental resources. Uses pictures worth thousands of words. Forward from Judith. If you like it, please spread the word, as there is no Koch funded marketing budget.

      • Rud, I hear your point and appreciate the effort. I just pt this link up and ask the rhetorical question if you think this person knows how many barrels are produced in a single day globally, say withing 15 MILLION BARRELS a day???

        http://dailycaller.com/2014/09/24/rosie-odonnell-thinks-u-s-is-fighting-isis-in-syria-because-of-oil-video/

        In reality this is pretty representative of the core “believer” in AGW. Do you really think the core is going to be moved by a debate over hyperbolic AR5 estimates and the convolutions to be sorted through?

        Harry Truman aptly observed that Adlai Stevenson was far more concerned about the votes of college professors then cab drivers not figuring out which was more important to win elections. At some point skeptics concerned for the broader society should review the political parable. Unless the writers are willing to go on the record as to why the IPCC overstated the data the story is worth just so much in the scheme and scale of the debate. Privately, 70% of this board including the writers know “why” it happened. Publicly, it isn’t considered proper discussion as a “science” topic.

      • cwon14, the Harry Truman thing is what the Ebook tries to accomplish. I am sure Judith knows that, because she said so in her forward to it that will be the Amazon Kindle lead in.
        Any assistance you can provide is also gratefully appreciated.

      • Rud
        M Huber and Reto Knuttti just published a Nature Geosciences paper 17 Aug “Natural variability, radiative forcing and climate response in the recent hiatus reconciled” vol 7 Sep 2014 that purports to analyze the hiatus vs CMIP5 models and finds the pause consistent with a reduced complexity model and mean of models. They adjusted input variables.

        Not the science is settled or the flat earth society but a sober look at the models and potential changes to make them match observations.
        Scott

      • That’s nice, Scott. We hadn’t heard the news. How often do you think they will have to adjust the input variables to keep that mob of unruly models in line with observations? It’s kinda like herding cats, ain’t it Scott?

      • Don Monfort

        Forgot offhand who said it but, “with four equations I can draw an elephant, and with five I can make the tail wiggle.”

        But a good faith effort to engage in modifying model equations and input parameters to more closely match the observations. That is what they and we are supposed to do.

        when models don’t match reality try to change them. Not the observations. Complicated by the past historical temperature changes cause those make the cats harder to herd.

        Scott

      • Hard to keep up. Don, it was John Von Neumann, one of the greatest mathematicians of the 20th century, who said that.

        Scott, the paper may have escaped my attention in the crunch to get the new Ebook to the publisher. I had a footnote, but not sure to this paper, and have not bothered yet to go check, since could not fix anyway as the book is ‘in press’. But changing inputs post hoc, and post seledting least biased models, both go counter to the scientific method as I understand it.

        For that understanding and how it has been multiply perverted, see my last book, The Arts of Truth. Even the title is a deliberate cynical example of the general perversion that ‘climate science’ so aptly illustrates.
        You might like the deconstruction of the EPA’s official Chevy Volt mileage certification on the sticker on every Volt window. Shows how truly awful things have become. The correct apples to apples number is about 37, far worse than the Toyota Prius.
        One plausible explanation for this perversion is that at the time, the U.S. government owned GM control in order to bail out the UAW. Another is that EPA staffers are cognitively challenged. Either would suffice for ordinary malfeasance were it not the EPA.

      • I am sure you have a point about endeavoring to improve the models, Scott. Everybody knows they need it. But I won’t read the paper. They have no way of knowing whether or not they have improved the models. They shouldn’t have written the paper and it should not have been published. Let them make some projections and get back to us in 15 years.

    • Steve Fitzpatrick

      Rud,

      Way back in 2011 SteveF, using a completely different approach, estimate a climate sensitivity of 1.56 per doubling. ;-) (http://rankexploits.com/musings/2011/a-simple-analysis-of-equilibrium-climate-sensitivity/)

      But you are right, the weight of the empirical evidence is that the canonical Charney sensitivity range is much too high. My person SWAG is that when better aerosol forcing data becomes available, ECS will ultimately be determined to be somewhere under 1.8C per doubling.

      • Steve, Judith hosted a guest post from me on ECS back sometime in 2012. It was an excerpt from the climate chapter of my last book, The Arts of Truth. It concluded after looking at all the then available studies using different estimation methods, that the probable ECS was maybe 1.9, and possibly as low as 1.6. My favorite was the most simple version, posted here by DocMartin for his peers to review. It gets a special shoutout in the sensitivity essay in the forthcoming book. I came out at about 1.7— before this new paper. So we are in basic agreement.

      • Rud, as simple as needed is always the easiest to write up,

      • DocMartin, Judith can find me. And when she connects us, a complementary copy (the publisher hates this) is on its way to you.
        Serious.
        Ask, and ye shall receive.

    • @ pokerguy

      > … industrialized nations are simply not going to intentionally impoverish themselves. Simply will not happen.

      Disagree. The UK is doing this right now. I admit I believed this could never happen in a democracy, but I was very, very wrong

  4. “The equilibrium climate sensitivity (ECS) is defined as the change in global mean surface temperature at equilibrium that is caused by a doubling of the atmospheric CO2 concentration.”

    Question-How was the point at which the climate is at equilibrium determined?

    Question- When referencing TCR in table 1, are the numbers shown the response during the “final periods” as compared to the base periods?

  5. Thanks for mention Judith.

    At one point I talked to Nic about the feasibility of turning the code into a webapp of sorts so that people could play with the various choices, so I’m glad to see he included the code and data.

    Looking forward to the discussion

    • The webapp would be fun. A lot of fun if you could incorporate regional impacts.

      • WebHubTelescope

        The Lewis is a POS analysis.

        The actual TCR is 2C and ECS is 3C.

        I already have a web app demonstrating this.

      • Sadly Web there are no DEMOSTRATIONS of what ECS is.

        There are estimations. All estimations have uncertainties. The largest uncertainty in your approach is unquantified.

        When you figure out the largest uncertainty in your method let us know.

        You wont see it, but it will be fun watching you struggle to find it.

        Look at the choices you made. That’s the clue

      • At this point I think folks would do well to remember Jim Cripwell.
        As he would point out we never actually measure ECS. we estimate it.

        As I would point out . There are just some things that we cant measure directly, things that we can only get at indirectly, through estimations

        There are some problems were we can only bound the answer after making assumptions. In these cases there is no definitive work, there are no demonstrations ( like web wants). There is only our best understanding

        1. Assumptions –which may or may not hold ( we can test the sensitivity
        to asssumptions.
        2. Data– and its uncertainties.
        3. methods– and their limits and biases.

        So, what you see in the paper is the answer you get if you make certain assumptions, if you use certain data, and if you apply certain methods.

        The choices made in these matters can be tested, that is, you can calculate the answer under a broad range of choices to see how your choices impact the estimate.

        Of course you can attack the assumptions– lay out what they are and make your best case. Of course you can attack the data– lay it out. And of course you can question the method.

        Now guess what? If you look at all the estimates you will find that none is free from assumptions, none is free from questions about the data, and no method is perfect. This doesnt mean we know nothing. It just means we have different rationally justifiable approaches that lead to different answers. Say hello to the uncertainty monster.

        Is this understanding sound enough for policy? sure. sound enough for good policy, maybe. sound enough for optimal policy? probably not.

      • WebHubTelescope

        It’s a POS analysis because anybody can look at the land response and note that it provides an upper bound estimate or ceiling to what the ECS will be. This is nothing more than logic and applied physics, which unfortunately seems to escape these deniers.

      • Scott Basinger

        WHUT, I look forward your Comment, which I am certain that with your eminence in the field will most certainly be published. Your brilliant rebuttal here shows you’ve got your feet planted on firm(ion) ground, once again.

      • Web hasnt read the paper or any of the other work on sensitivity.

        The most important aspect of the paper.

        “Uncertainty in aerosol ERF is the largest contributor to imprecision in estimating ECS and
        TCR. Uncertainties in heat uptake and in WMGG forcing are substantially less important. Progress in
        reducing aerosol forcing uncertainty is therefore key to narrowing observationally-constrained estimates
        of climate sensitivity. Without a reduction in aerosol ERF uncertainty, additional observational data and
        extended time series may not lead to a major reduction in ECS and TCR estimation uncertainty.”

        Now, ask me how to tune a GCM to get a lower sensitivity.?

      • “the largest uncertainty in your method…you wont see it, but it will be fun watching you struggle to find it.” The first step, as they say, is recognizing that you have a problem. I’m not holding my breath.

      • Mosh

        Excellent work from Judith and Nick.

        I think yu have made a key point in saying ‘If you make certain assumptions’

        They are big assumptions.

        If we backtrack we can see that the entire ipcc narrative is about temperature

        Callendar in 1938 estimated the global temperature

        In 1988 Hansen used much the same data for his estimate. Ten years later dr Mann posited the revisionist view of climate with eventually an estimate of temperature back 1000 years.

        The met office until very recently maintained that until mans interference in the early 1900’s the climate was essentially stable.

        Curiously it was left to Phil jones to admit in 2006 that natural variability was much greater than he had hitherto realised. This was when the grandfather of all hockey sticks occurred from 1695 to 1739 but came to a screeching half in 1740 with an extremely severe winter.

        Until the 2000’s the 1730’s were the warmest decade on record.

        So temperature is important and assuming that such nonsenses as global SST’s back to 1850 are a valid matrix reinforces those assumptions and upon that are built all sorts of calculations that demonstrate that we know why the temperatures have been rising because the co2 hypothesis reinforces this.

        However, the period since the 1850’s and especially over the last 50 years is fairly benign. It has a lot in common with some, but not all, of the mwp from around 890 to around 1180 . We can see very substantial climate variability within that period but it can be characterised by being mostly warm and mostly benign.

        Not so the next 500 years which had in it periods as warm as today and colder than today and many extreme weather events.

        So, IF you were to do your calculations on the assumptions that natural variability is great and the control period was one of the warm eras in the last thousand years what would then be the estimate of sensitivity?

        As for volcanos, I have had this discussion numerous times. In theory the climate may be affected for decades but in practice the effect is transient so there we have another assumption automatically factored in.

        So, my question really is, if we were to assume that periods in the past were warmer than today would the physics still demonstrate a rise of over one and a half degrees is still going to happen?

        Tonyb

      • Like with the Bose-Einstein statistics fiasco, these deniers don’t have a clue about statistical mechanics, continuity equations, or transport theory. webnutcolonoscope

        The land surface temperature record reflects a balance of kinetic and latent energy which changes with water availability. The land/ocean contrast is obvious but he invests it with a significance it simply doesn’t have.

        And the Bose-Einstein fiasco is webnutcolonoscope. He insists he knows something but of course refuses to define and was MIA – presumed incompetent – in the relevant post.

        Why are we putting up with this monster of misinformation?

      • Computah says ‘no’ Tony.
        Prob’ly closer ter 1 degree than the IPCC ~3 degrees.

      • Tonyb

        “If we backtrack we can see that the entire ipcc narrative is about temperature”

        Lets start with Nics equation

        ECS = Fco2 * dT/(dF-dO)

        where Fco2 = forcing due to c02 doubling
        dT = delta temp from begining period to ending period
        dF = change in Forcing
        dO = change on OHC

        Lets start with the whole equation. There are skeptics who object to the entire IDEA of this equation. The best example is Willis. There are other types of objections, but at the bottom they all object to the notion of capturing , describing, characterizing, the complex system of the climate with a simple equation. They will never get much of a hearing. In the end the equation will either do a good job or not. Iin other words, I don’t think “systematic” skeptics have much of a role to play in the debate. They are outside the conversation. To be invited to this debate you have to accept, EVEN IF ONLY PROVISIONALLY, the notion that sensitivity is a meaningful metric.

        Next

        Fc02 skeptics: These are people who reject the idea that doubling c02 has ANY effect. They are sky dragons. There are some shades of grey here as some folks may question radiative physics in other ways. Again, rejecting the notion that C02 warms the planet is outside the debate.

        dT skeptics. these are people who question the temperature record. Note
        we only need to talk about the 1850 to present record. PALEO doesnt matter. Mann doesnt matter to this debate. Let me put it this way, If you
        question the temperature record you can, using Nics approach, calculate the importance of your skepticism. That is, if you think the record is .2C too high, you can actually run his code with what you think the record SHOULD be.
        To do this however you have to do the fricking work of developing an alternative record. Look at the form of the equation.. There isnt a lot of power in changing dT. Finally, if you are a skeptic looking at dT, you need to characterize your work in terms of SENSITIVITY. that is, you are interested in temperature BECAUSE of the role it plays in the vital equation.

        dF skeptics.. lots of types here.. some cranks.. The best skeptical line of attack is against aerosols.

        dO.. folks who object to our ways of estimating changes in OHC

        personally I think skeptics would do much better by centering themselves INSIDE this debate. By giving up the hoax crap, by ignoring Mann, and by working within the framework that the Equation describes. If you work within this framework you have a chance at improving the science, If your skeptical hunches play out you have a chance of eliminating the case for catastrophe.

        or you can stay outside the debate and cry about nobody wanting to debate you

      • WebHubTelescope

        You don’t seem to realize it is not me that you are challenging, but the science that says the ECS has been 3C since the Charney report came out in 1979.
        Read p.17 http://web.atmos.ucla.edu/~brianpm/download/charney_report.pdf

        I did my thing and verified that it was 3C based on looking at land warming.

        It certainly is fun watching you struggle with the simplest analysis wrt climate science imaginable

      • “Ten years later dr Mann posited the revisionist view of climate with eventually an estimate of temperature back 1000 years.”

        Normally in science, there’s a push back from the establishment against such a profound change in our understanding of things.. Just like that, with the wave of a magic hockey stick the MWP was erased, likewise the LIA. And yet consider the alacrity….even the jubilation… with which this major rewriting of climate history was embraced.

      • webster, “I did my thing and verified that it was 3C based on looking at land warming.”

        Right, you verified an average of guesses. Instead of there being science that indicated 3 C, there was science that indicated 2 C and science that indicated 4 C, the Charney report average the two SWAGs and came up with 3C. If you wanted to actually “verify” the science you would show where Manabe was wrong low and where Hansen was wrong high. As it stands, climate sensitivity is an average of guesses. Should Hargreaves and Annan revise their Bayesian analysis with current guesses, sensitivity will be lower. If the removed bias guesses, it could be lower still.

        This paper just shows that using the “accepted” guesses, that the “accepted” methodology shows that the modeled guesses are high by a factor of nearly 2.

        Fell free to replace guesses with some PC term, but that it the state of the science.

      • Mosher @ 2.43: good post. The implication for policy is that the latest estimates suggest that global warming is unlikely to be a major problem, and that politicians and policy makers need to revisit the assumptions which underlie their policies.

      • Mosh

        Lukewarmer is defined as neither warm nor cool. That seems to me to be usefully categorised as at equilibrium or normal or usual .

        In other words neither one thing or the other.

        If the definition is as per the first paragraph I would describe myself as that, so I’m allowed to play the game and have an opinion.

        So are you also saying that co2 has a limited effect on changing The equilibrium from one climate state to another or do you argue for something stronger, which would mean that you aren’t a lukewarmer a all but a rather warmer version?

        Tonyb

      • Web,

        You now say:

        > I did my thing and verified that it was 3C based on looking at land warming.

        I prefer “verified” to “demonstrated,” the only (?) word that has been challenged regarding what you said, not you nor the science itself. But I’d prefer something a tad weaker, like “I did my homework and my results agree with the established viewpoint”.

        If you had something like “according to my homework, it is not plausible to get less than what I got, and here’s why,” then you’d have something that could directly challenge what Nic does article after article. Until something like that gets done done, nothing will prevent the lowest sensitivity justified disingenuousness can buy. And even if you do, it is to be expected that the smallest increment that circumvent your demonstration will be marketed.

        Perhaps I am biased, for I like apps. But I doubt it.

        Dick showed the way a long time ago.

      • Web,

        By sheer serendipity, I just read a comment that illustrates what I have in mind:

        http://judithcurry.com/2014/09/24/lewis-and-curry-climate-sensitivity-uncertainty/#comment-632505

        I don’t see any other way to play on the line of scrimmage.

      • Matthew R Marler

        webhubtelescope: The Lewis is a POS analysis.

        You can be assured that your detailed objections will be well read here.


        The actual TCR is 2C and ECS is 3C.

        I already have a web app demonstrating this.

        Is that, like the Lewis and Curry paper, based on the most recent IPCC report? Everybody has a demonstration of some sort, but Lewis and Curry took what is presented as the most authoritative recent comprehensive review.

      • Matthew R Marler

        WebHubTelescope: You don’t seem to realize it is not me that you are challenging,

        Oh, that is not true. They are challenging you: your choices and the uses that you made of them.

      • Matthew R Marler

        Steven Mosher: To be invited to this debate you have to accept, EVEN IF ONLY PROVISIONALLY, the notion that sensitivity is a meaningful metric.

        Maybe so, but the sensitivity can’t reasonably be considered constant. that is because the water vapor pressure is supralinearly related to temperature: that is, a temp rise from 289K to 290K has a larger effect on vapor pressure (so, most likely, on the evaporation rate) than does a temp rise from 288K to 289K. Only if you assume that there is not a corresponding increase in cloud condensation and precipitation can you ignore that: it implies that a 3.7W/m^2 increase produces a lower temp increase at 289K than at 288K. Equilibrium calculations ignore the rate changes, but it seems to me more likely that the rate of the hydrological cycle increases at the higher temperature, producing the non-constant sensitivity that I just described.

        This is one of the uncertainties deserving of more research, in my opinion. Notice also that, as I wrote, the sensitivity is not constant even ignoring the possible increase in cloud cover corresponding to the increased rates of evaporation, condensation and freezing, and rainfall. If in addition cloud cover increases, that further decreases the sensitivity, and the effect of increased cloud cover is greatest at the highest temperatures of the surface water.

        There is value, as you say, in agreeing to play the game by IPCC rules. But the rest of science should not always be ignored.

      • WebHubTelescope | September 24, 2014 at 2:02 pm
        I already have a web app demonstrating this.

        You’re ‘avin a larf, innit?

      • Web

        The charney report? really?

        1. It uses models. hansen and the rest of science all agree that models dont give you the best estimate.
        2. If you correct for the biggest error in the report the ECS will go down by 10% at least.

        Question: what estimate or what CRITCAL value in the equation
        ECS – Fco2* dT/(dF-dO) is WRONGin the charney report and too high by 10%.

        In other words there is one value in that report that is estimated lower today than it was when the report was written.

        What is that value?

        In short, science continues to progress. 3C for doubling isnt ruled out to be sure. the probablity that it is 3C or less is greater than 50%

        So the biggest uncertainty in your approach… is… wait for it..

      • The estimable Jim Cripwell
        Has met his measure.
        =================

      • Mosher, your post at 5:08 is very good, frames the debate nicely.

      • Hunches? We muck out the stables.
        ========

      • > There are estimations.

        Derived estimates, more precisely.

        At least that’s how Nic presents them.

      • Take it up with the BEST team. They were the ones that put out a spreadsheet that included an estimate of ECS that was 3C.

        Perhaps Mosh should take it up with them first. Maybe hide that spreadsheet?

        In any case, just do the numbers. Lewis is a low-baller — no surprise there.

        http://imageshack.com/a/img538/2338/9NnM75.gif

      • Mosher: “or you can stay outside the debate and cry about nobody wanting to debate you”

        And this is exactly the reason for the meeting in Bath. That one meeting is a cornerstone for some good things to come in the future.

      • Matthew R Marler

        WebHubgTelescope: In any case, just do the numbers.

        Your model overestimates climate sensitivity to CO2 because CO2, land use changes, and background variability are all correlated over that interval.

        You could assume that, after 1850, there would be a continuation or else intensification of the low temperature regime called the Little Ice Age. In light of the near periodicity in the temperature fluctuations of the previous 10,000 years that would represent an abrupt change in the natural background variation, so it seems unlikely. But it isn’t inconceivable.

      • Mosh

        Upthread you said to be a player in the science debate you need to accept the importance of co2 sensitivity.

        In the climate debate there are a number of different arenas.

        There is the science arena, one for politics, the public, big business, the media, green activists and even one for crackpots, which some of the denizens here and elsewhere seem to have wandered into.

        In the science arena there are numerous scientists Endessly arguing a number of rather esoteric points, some of which seem rather doubtful And not based on observational evidence

        Different things are happening in each of the other arenas! with some of those on the central stages being interchangeable between one arena and another.

        Do you remember that John Lennon (probably) said ‘Ringo the best drummer in the world? He’s not even the best drummer in the Beatles.’

        Mosh, Things have moved on and in the climate debate science is no longer the best arena to be in. Things are being decided elsewhere.

        Tonyb

      • Jonathan Abbot.

        Thank you. One of these days I will end up writing a complete description of the feild of the debate in terms of Equation number 1 from Nic’s paper.

        It’s important, I think, because skeptics have had a hard time placing or positioning their concerns relative to the dialog or debate that happens within science.

        Let me use an example: My friend Anthony Watts.

        Anthony cares about the temperature record. And he currently frames his concern around the concepts of doing measurements correctly. As such the dialog often turns to harsh criticism of NOAA, to speculation about motives, and to unquantified assertions that the record is unreliable.
        It’s seen as an attack on science. An attack on specific people. Now, of course all of that may be true or some of it may be true or none of it may be true. But in the end the framing controls the perception of his work.

        When I look at Anthony’s work I see something different.

        I see ECS = Fco2 * dT/(dF-dQ)

        I see that Anthony’s work addresses dT. What was the temperature in 1859-1882 and what is the temperature now ( 1995-2011) and what is the difference in temp between these periods.

        So I construe his work as being important to the calculation of sensitivity.
        Construed this way he is working INSIDE of the science working to improve the calculation of dT. To adopt this positioning he needs to extend his work and calculate an alternative series accounting for his concerns. Such an account would probably decrease dT or alternatively increase the uncertainty bounds. His work would then have meaning within a framework that people accept: “we need to estimate sensitivity”

        one can even fit in people who believe in natural variability— dF

        To give you a hint I suspect that Judiths next paper with Nic will address Natural variability by either looking at what portion of dT can be assigned to natural variability or they might assign some dF to natural variability.
        Not sure I havent seen it.

        Skeptics would do better to occupy the framework than to attack it from the outside.

      • Here?

        Mosh confuses the progress of science with skirmishes in the climate war. Ultimately science leads to something real – skirmishes lead to talking points superficially in the objective idiom of science.

        http://watertechbyrie.files.wordpress.com/2014/06/ghil-sensitivity.png

      • Matthew R Marler

        Steven Mosher: When I look at Anthony’s work I see something different.

        I see ECS = Fco2 * dT/(dF-dQ)

        I see that Anthony’s work addresses dT. What was the temperature in 1859-1882 and what is the temperature now ( 1995-2011) and what is the difference in temp between these periods.

        That is a good comment.

        Personally, I don’t think that equation is useful for the future, but it is certainly taken seriously by the established scientists, and working with it consistently and rigorously, as Lewis and Curry did, ought to be (and I think it will be) to those established scientists.

        Nobody pays attention to Rob Ellison or me, but this paper can not easily be ignored by the community that takes the IPCC AR5 seriously. Has anybody proffered a criticism that is concordant with the IPCC AR5?

      • ‘Prediction of weather and climate are necessarily uncertain: our observations of weather and climate are uncertain, the models into which we assimilate this data and predict the future are uncertain, and external effects such as volcanoes and anthropogenic greenhouse emissions are also uncertain. Fundamentally, therefore, therefore we should think of weather and climate predictions in terms of equations whose basic prognostic variables are probability densities ρ(X,t) where X denotes some climatic variable and t denoted time. In this way, ρ(X,t)dV represents the probability that, at time t, the true value of X lies in some small volume dV of state space. (Predicting Weather and Climate – Palmer and Hagedorn eds – 2006)

        ‘Lorenz was able to show that even for a simple set of nonlinear equations (1.1), the evolution of the solution could be changed by minute perturbations to the initial conditions, in other words, beyond a certain forecast lead time, there is no longer a single, deterministic solution and hence all forecasts must be treated as probabilistic. The fractionally dimensioned space occupied by the trajectories of the solutions of these nonlinear equations became known as the Lorenz attractor (figure 1), which suggests that nonlinear systems, such as the atmosphere, may exhibit regime-like structures that are, although fully deterministic, subject to abrupt and seemingly random change.’ http://rsta.royalsocietypublishing.org/content/369/1956/4751.full

        You may dance around the issue all you like Matthew. The fact remains that both climate and models are chaotic and the prediction of future states is impossible.
        This is the new climate truth – and you may accept it or not. In the end there will be those on the right side and those in the disgruntled rump – do try to be ahead of the curve and not just a grumpy old man.

      • “I already have a Web app demonstrating this” – Webby

        Ha ha ha ha ha ha ha ha ha ha ha ha! Now I am starting to feel sorry for you.

      • @Rob Ellison

        Lorenz was able to show that even for a simple set of nonlinear equations (1.1), the evolution of the solution could be changed by minute perturbations to the initial conditions, in other words, beyond a certain forecast lead time, there is no longer a single, deterministic solution and hence all forecasts must be treated as probabilistic. The fractionally dimensioned space occupied by the trajectories of the solutions of these nonlinear equations became known as the Lorenz attractor (figure 1), which suggests that nonlinear systems, such as the atmosphere, may exhibit regime-like structures that are, although fully deterministic, subject to abrupt and seemingly random change.’

        You do understand that Webby already has several web postings that show that such chaotic effects may be safely ignored, and are in fact “crutches for weak minds.”

        Lorenz should know that Webby has overturned his work, he just doesn’t bother to publish on the subject.

      • Invoking chaos is a crutch for a weak mind.

        We see it demonstrated in spades on this comment thread.

      • The success of climate models at predicting The Pause proves you are right Webby.

      • ‘Like with the Bose-Einstein statistics fiasco, these deniers don’t have a clue about statistical mechanics, continuity equations, or transport theory. webnutcolonoscope

        The US National Academy of Sciences (NAS) defined abrupt climate change as a new climate paradigm as long ago as 2002. A paradigm in the scientific sense is a theory that explains observations. A new science paradigm is one that better explains data – in this case climate data – than the old theory. The new theory says that climate change occurs as discrete jumps in the system. Climate is more like a kaleidoscope – shake it up and a new pattern emerges – than a control knob with a linear gain.

        The theory of abrupt climate change is the most modern – and powerful – in climate science and has profound implications for the evolution of climate this century and beyond. A mechanical analogy might set the scene. The finger pushing the balance below can be likened to changes in greenhouse gases or any of a number of potential control variables. The climate response is internally generated – with changes in cloud, ice, dust and biology – and proceeds at a pace determined by the system itself.

        http://watertechbyrie.files.wordpress.com/2014/06/unstable-mechanical-analogy-fig-1-jpg1.jpg

        Many simple systems exhibit abrupt change. The balance above consists of a curved track on a fulcrum. The arms are curved so that there are two stable states where a ball may rest. ‘A ball is placed on the track and is free to roll until it reaches its point of rest. This system has three equilibria denoted (a), (b) and (c) in the top row of the figure. The middle equilibrium (b) is unstable: if the ball is displaced ever so slightly to one side or another, the displacement will accelerate until the system is in a state far from its original position. In contrast, if the ball in state (a) or (c) is displaced, the balance will merely rock a bit back and forth, and the ball will roll slightly within its cup until friction restores it to its original equilibrium.’(NAS, 2002) In (a1) the arms are displaced but not sufficiently to cause the ball to cross the balance to the other side. In (a2) the balance is displaced with sufficient force to cause the ball to move to a new equilibrium state on the other arm. There is a third possibility in that the balance is hit with enough force to cause the ball to leave the track, roll off the table and under the sofa.

        Webnutcolonoscope is incorrigibly incapable and is driven by resentment and malice – seemingly overlying a deep seated presentment of inadequacy. Like most of these purveyors of fantastic narratives – any discussion is at the level of abstractions without obvious links to simple descriptions, precise details.or academic sources. in webnutcolonoscopes case it is usually lacking any substance but merely abuse, aggression, misrepresentation and malice.

        The Bose-Einstein fiasco is webnutcolonoscopes. He insists he knows something but of course refuses to define and was MIA – presumed incompetent – in the relevant post.

        Why are we putting up with this monster of misinformation?

    • I’m curious: according to this “app”, how do the estimates for climate sensitivit(ies) change for every month of The Pause?

      • it wont change much.. But the longer the pause goes the smaller
        the ECS becomes

        A longer pause means dT doesnt change.
        But dF ( change in forcing) goes up.
        dO can also go up if heat is stored.

        So. to narrow the range we need better measures of dO and better measures of dF. The uncertainty in dF is dominated by aerosols.

        If we believe that observationally based estimates are the best ( an assumption with uncertainty ) then we really should be
        A) resolve the uncertainty in aerosols.
        B) measure the ocean better.

        If we believe that paleo approaches are best ( an assumption with uncertainty) then we need to spend a lot more on Paleo work.

        If we believe that model based approaches are best, then we need to have our heads examined.

      • “A longer pause means dT doesnt change.
        But dF ( change in forcing) goes up.
        dO can also go up if heat is stored”

        Steve, note also that during this hiatus we have had lower than average volcanic emissions of aerosols and SO2 (as Nick and Judy noticed).
        During that last decade both CO2 ‘forcing’ is up and volcanic ‘forcing’ is down.

        http://data.giss.nasa.gov/modelforce/strataer/tau.line_2012.12.gif

        The high aerosol/high CO2 ‘forcing’ reciprocal explanation for steady state temperature fails when CO2 increases and volcanoes are silent.
        This I think is the most important thing in Nick’s and Judy’s paper.

      • Additionally Steve, I don’t think OHC is going to ride to the rescue given this
        http://oceans.pmel.noaa.gov/images/OHCA_curve_2012.png

        Now it could be argued that warm water from the surface layer is getting injected into deeper layers, being replaced by colder water.
        Were this postulate true, we would have noted a change in the atmospheric composition of CO2, due to warm (CO2 denuded) water being replaced by cool (CO2 rich) waters.

        http://www.ferdinand-engelbeen.be/klimaat/klim_img/temp_emiss_increase.jpg

      • So. to narrow the range we need better measures of dO and better measures of dF. The uncertainty in dF is dominated by aerosols.

        But what about dO? Does it matter?

        And another question: changes in aerosol due to biologic changes (e.g. vegetation cover changes): Do they count as part of dF?

      • Now it could be argued that warm water from the surface layer is getting injected into deeper layers, being replaced by colder water.
        Were this postulate true, we would have noted a change in the atmospheric composition of CO2, due to warm (CO2 denuded) water being replaced by cool (CO2 rich) waters.

        AFAIK that’s not how it works:

        (Comparatively) small amounts of warm water are always being mixed into deeper layers by meso-scale turbulence, carrying large amounts of heat with them. This is counteracted by a much larger amount of upwards motion of the entire deeper part of the ocean, which mostly comes to the surface along west continental coasts. This occurs to balance, and is mostly determined, by the volume of cold water subducted at the poles. (Both the polar subduction and the general rise of deeper water represent an upwards flow of heat.)

        The “OHC changes” are the result of differences between the downwards flow of heat due to turbulence, and upwards flow due to the general rise of deeper water (and polar subduction).

        AFAIK there’s no reason to expect any change to the rate at which cold water arrives at the surface. Or at least, no reason to suppose it has any relationship to the rate of downwards heat flow due to turbulence.

      • Now it could be argued that warm water from the surface layer is getting injected into deeper layers, being replaced by colder water.
        Were this postulate true, we would have noted a change in the atmospheric composition of CO2, due to warm (CO2 denuded) water being replaced by cool (CO2 rich) waters.

        Oh you mean like the SH mid latitude stations,where the co2 growth rate has decreased ,and the lag rate from MLO ( the interhemispheric gradient ) has increased from around 18 months to 48 months.

        Suggested reasons are.
        i) a decrease in mid to high latitude winds in the 21st century.
        ii) increased southern sea ice.
        iii) increased efficiency of the SO sinks.

      • maksimovich, global dude, global. Upper 700m temps flat, so if they are under the glare of an increased heat flux then more hot water has to go down to the depths and, in a zero sum game, cold water from below 700m must come up. The rate at which, increasing, CO2 is taken from the atmosphere by the oceans should have declined (if you buy the whole chemical equilibria spiel).

      • I agree with Mosher. I tend to like the proposal to improve ocean temperature data acquisition…. I really used to suffer launching XBTs in the 1970’s. We’ve come a long way but it can get better.

    • Steve Mosher, an excellent response to TonyB, whose own work I also find excellent. When you aren’t cryptic, you are eloquent and persuasive.

      Btw, the new book essay When Data Isn’t never attacks the BEST reconstruction. It does attack NCDC, GISS, HadCruT4, BOM ACORN and previous HQ… In fact your previous post here of BEST smoothed monthly compared to the others is prominently featured with appropriate attribution in re Cowtan and Way.
      You will, however find in a last footnote that the problem of regional expectations is highlighted by 166900, about which you previously accused me of being statistically illiterate. An unfortunately wrong assumption.
      I also personally checked all the BEST reconstructions for every other other temperature station specifically cited (amongst others Rekyavik, Sulina, de Bilt, Darwin, Rutherford Glen, Tokyo, Hachyiko) and found them all quite reasonable in light of what is known. Complements on a temperature job overall rather well done.
      Now can you get McKittrick to apply his newest stats methods to the BEST record post say 1998? You know, the more 17 year pauses there are, the more Ben Santer and his 2011 paper will have to eat crow. And right now, that is politically important .

    • Mosher,
      If you consider your formula below – which is a good way of simplifying the method there is one thing that bothers me, the same thing that bothers me about the paper itself.

      There are three climate datasets which describe delta T.
      HadCRUT4v2
      BEST (Land+Ocean)
      CW2014

      LC2014 gives a temperature change between 1859-1882 and 1995-2011 of 0.7097°C with Hadcrutv4 compared to 0.7746°C with CW2014 and 0.7736°C with BEST respectively. Now these differences won’t substantially change the results but will raise the TCR and ECS somewhat. I think its an easy criticism to make and to test and it just surprises me that the authors did not address it in the paper.

      • Robert, you are, in the colloquial, mispicking fly sh!t from pepper.
        You missed the point. Using AR5 best T, Q, F estimates, the AR5 estimate and range are reduced substantially, and the CMIP5 models thereby falsified.

        BTW, three fundamental statistical criticisms of your paper are leveled in my forthcoming book in essay Unsettling Science. I look forward to any substantive technical critique you might have of that. Here or direct via Judith, but not at SkS. I am engaged in helping Prof. Tol with regards to Cook’s PR site. Just so that you know.

      • Robert early on I suggested that C&W be used or tested and put in the SI. So I would agree this
        US an important sensitivity to look at.

      • Rud Istvan,
        I’m commenting on an aspect of the paper that could be improved not the ‘bigger picture’. On the subject of the bigger picture – their key point that uncertainty in aerosol forcing needs to be better constrained is something that is very relevant.

        If you have fundamental criticisms of the CW2014 paper then you’re welcome to provide them. There have been of course papers such as this one (below) which look specifically at our results and we welcome more dialogue.

        As for your bringing up Dr. Tol and Sks – you’re of course welcome to talk about whatever you please. But I’m here discussing another subject and I have no intention of detracting from that.

        Mosher,
        Yes that’s a wise suggestion. I don’t really have time for a while to go through their code but perhaps i’ll take a bit of time in a couple weeks to pick my way through it. I think that the agreement between CW2014 and BEST provides a further imperative to test sensitivity.

      • Ya, I havent had an opportunity to crack open the code, but I think the first order of business is to put in C&W. I’d do BEST but we have to publish it first.

      • Robert Way | September 24, 2014
        There are three climate datasets which describe delta T.
        HadCRUT4v2 OKayyyy
        BEST (Land+Ocean) Arm twisted
        CW2014
        No this is a model Robert, not a data set.
        Models can take data in but they are not data.
        They are an assumption , a guess or in this case a whim.

        Steven Mosher | September 24, 2014
        I think the first order of business is to put in C&W. Coz he’s my mate?
        No really Steve, the first order of business is to use real data.
        Nice to see Robert commenting though, one of the few.
        Tough skin.
        To paraphrase Mosher
        “personally I think climate scientists would do much better by centering themselves INSIDE this debate.”

      • HadCRUT4, BEST, and CW2014 are all temperature indices. They all tell about the warming of the Earth near surface. They are calculated using specific methods and describe something that can be crudely described as the average surface temperature, but it’s not clear, what The Global Mean Surface Temperature really is. Even less clear is, what’s the “best” or most useful index of global surface temperatures.

        It need to be recognized that the methodology HadCRUT4 leads to lesser warming, and that the difference is related to lesser coverage of high latitude temperatures. Thus “HadCRUT4-sensitivity” is smaller than “CW2014-sensitivity”. When either one is used in a situation where a difference of about 10% matters, it must be known, which of the sensitivities is used. When comparing the result to some other number like the sensitivity seen in a model, apples should be compared to apples and oranges to oranges. Thus it should be known, what is the coverage implied in the model calculations, and comparison should be made with the corresponding index.

        In many cases it may be easier to use the model to calculate its index for the coverage of a specified empirical index. That’s probably the preferred approach for comparison. It could be worthwhile to check also, whether the model can explain the difference between HadCRUT4 and CW2014. If not, that’s a weakness of the model. In such cases it’s not obvious at all, which of the indices is more applicable for the particular comparison.

      • Clearly written, Pekka, and a possible nudge back up; still not by much. Thanks.
        ========

      • Shame on you Kim (a la the Princess Bride) Pekka has a cloak of respectability which you have fallen for.
        First C and W is a made up model with no stations to contradict them. It is NOT a data set. It is a model. Double shame on Pekka, to say that “in many cases it can be easier to use the model”.
        Of course it is , a model is not real, if there are problems you just alter the model. Want some extra made up data tweak the model, easy as pie.
        Life is not “easier”, life is real data, inconvenient missing data, having to deal with anomalies that do not agree with your modelling.
        Nowhere does the C and W “model” ever show a negative anomaly where there is a chance for uncertainty.
        I realise a lot of people respect Pekka, like Robert Way he posts and discusses. What I do not like is his pervasive pushing of models , not data, in a gently, gently way as if something wrong can be made right by approaching it slowly.

      • Robert Way and Mosh

        That would be a fine project for the two of you. Since there is a question about how useful “global” surface temperature is a proxy for energy, perhaps you could highlight the regions that produce the largest differences between interpolated and not interpolated temperature reconstructions? Interpolating (kriging) across phase changes was an issue Dr. Curry mentioned at one time, so you could kill two birds with one stone. Since in the highest Arctic winter you have a variation of 5 degrees (about 16.8 Wm-2 variation) influencing a mean of about 16 C (about 28.1 Wm-2 per 5C variation), the relationship between temperature and energy per degree becomes a bit confusing to some.

      • What he cloaks is fear, angech; if faith in models works for him, data will eventually ease the fear.
        ===============

      • angech

        “I think the first order of business is to put in C&W. Coz he’s my mate?”

        i support the work of all my mates who lay out their methods and data.

        1. Mcintyre
        2. Watts
        3. Nic Lewis. ( read the acknowledgments in this paper)
        4. Zeke
        5. Troy Masters
        6. JeffId and Odonnell

        doesnt matter to me if they are more or less warmist than me. If their work is open I support looking at it.

      • Another fact is that policy makers must appeal to science to tell them whether AGW will be a problem and what you should do about it.

      • Matthew R Marler

        Robert Way: LC2014 gives a temperature change between 1859-1882 and 1995-2011 of 0.7097°C with Hadcrutv4 compared to 0.7746°C with CW2014 and 0.7736°C with BEST respectively. Now these differences won’t substantially change the results but will raise the TCR and ECS somewhat. I think its an easy criticism to make and to test and it just surprises me that the authors did not address it in the paper.

        That variability adds modestly to the uncertainty in the final estimate.

    • Mosher says: “personally I think skeptics would do much better by centering themselves INSIDE this debate.” I think the most effective skeptics do.

      I have the “so what?” approach. Warmer is better. A lot warmer is a lot better. Many alarmists are constrained in a contradictory cognitive box. On the one hand, contemporary society is “really bad” in so many ways; on the other hand, forcing a complete remake of contemporary society by, say, a 100 meter sea level rise is unthinkable.

      • RobertinAz :”I have the “so what?” approach.”

        I have the so what approach to your comments.

      • Robert, that may be caused by your location in Arizona? You are very far from the ocean, and it can’t possibly get hotter. But if it did you have air conditioned everything. Right?

    • Things have moved on and in the climate debate science is no longer the best arena to be in. Things are being decided elsewhere.
      Tony,

      AGW as a theory lives, is modified, or dies in the science arena.

      • Joseph

        Agw is like the hydra, you can cut off one head and another will grow.

        It will continue as a scientific concept in scientific circles although the finer details of it will be modified over time, as in the paper we are discussing.

        However, politics, economics and public indifference will eventually see it sidelined as other arguments are advanced more compelling than the scientific one has turned out to be.

        This is not intended to be a slight on nic and Judith’s excellent paper but we are in danger of dancing on the heads of pins.

        I increasingly get the feeling we all need to get out more…

        Tonyb

        Tonyb

    • Mosh confuses the progress of science with skirmishes in the climate war. Ultimately science leads to something real – skirmishes lead to talking points superficially in the objective idiom of science.

      https://watertechbyrie.files.wordpress.com/2014/06/ghil-sensitivity.png

      • Nice graphs, except the oscillations in 3 should be aperiodic. Chaos is aperiodic.

        Then too if CO2 sensitivity is sensitive to initial conditions then chart 3 will look very different for minutely different step ups in CO2, differences too small to measure or show. T may even go down for some values. So there is no such thing as the sensitivity. Chart 3 should have a bunch of variations that look very different from one another, all starting from the same point at the top of the CO2 step up.

      • Then too if CO2 sensitivity is sensitive to initial conditions then chart 3 will look very different for minutely different step ups in CO2, differences too small to measure or show.

        Given how CO2 works to affect the climate, sensitivity could well be is almost certainly sensitive to geographic boundary conditions as well. Perhaps more likely.

        For instance, if the Panama Straits were still open, the sensitivity would very probably be different. If the top of Mt. St. Helens were still there, it might be. Same goes for different vegetation in the Taklamakan, or Tibet, etc.

        There may very well be ways in which anthropogenic processes have affected CO2 sensitivity as well as pCO2. This would just make the problem more wicked.

      • Talk about over interpreting a schematic David. It shows a change in mean and variance – which is the definition of a non-stationary system.

        T may even go down depending on the emergent system response.

      • Sorry Rob, but you said nothing to indicate that was all the graphs were intended to show. I think it is important that there is no such thing as climate sensitivity, not in the sense of a knowable result to doubling CO2. So everyone is arguing over a scientifically bogus concept. This is not good.

      • Amen to David Wojick’s contention on September 26, 2014 at 5:23 pm.

      • The regimes are non-stationary. A different concept to aperiodic. This is what the diagram shows.

    • Matthew R Marler

      Rob Ellison: You may dance around the issue all you like Matthew.

      whatever

  6. This paper is an excellent contribution. If this is confirmed in the future we can be confident the global warming problem is solvable.

    A well paced effort to reduce green house gas emissions can also help us transition away from fossil fuels in a “gentle fashion”, without threatening lifestyles or making traumatic changes.

    Future solution designers should focus on two fundamental issues: one, if we keep adding greenhouse gases it´s likely to get warmer, and two, we can´t expect to produce (rather cheap) fossil fuels forever. If we keep those two in mind it´s much easier to visualize how to work the two issues together to get us to safe harbour.

    • Fernando writes- ” If this is confirmed in the future we can be confident the global warming problem is solvable.”

      Aren’t you jumping to a conclusion that it is a problem?

      • Rob, if the temperature were to keep increasing sea level would also rise. I really can´t say I´m that confident about the 2 degree C limit selected by the powers that be. But I do know the surface temperature increase drives sea level rise, and sea level rise can cost money. Therefore I think it´s a problem to be solved.

        Also don´t forget that my background in the oil industry tells me we could be facing steep fossil fuel price increases later this century. This makes me consider activities to reduce fossil fuel emissions to be coherent with the proper handling of the economy.

        An excellent example of how the two sides can work together would be the way wind power and gas fueled generators have been coupled in Texas. The way it works, wind power helps extend gas reserves. Gas producers are suffering losses at this time, however, the price will eventually rise and the stronger producers will do well.

      • Fernando
        Temperatures have been increasing and overall ice levels (northern & southern) appear to have remained pretty stable. The rate of sea level rise has not increased. As long as sea level rises fairly slowly it is easily adapted to over time and may provide net benefits.
        The issue of fossil fuel depletion is a real issue but not related to the control of CO2.
        Imo-people describing the situation as a “problem” prematurely leads to those and other people promoting CO2 mitigation actions. Those actions seem generally wasteful of limited resources.

      • Rob, whether the rate of sea level rise hasn’t increased is debatable. It all depends on the reference point. Whether ice cover is constant or not isn’t really relevant, in the sense that I’m only discussing sea level increase caused by water expansion as it warms up (this has nothing to do with glacier or continental ice melt). Therefore the current temperature increase leads to sea level increase versus the sea level we would see without the temperature increase. That’s not really debatable.

        Whether the fossil fuel depletion problem is related or not is in the eye of the beholder. I’m used to solving complex problems, and I see synergy in tackling both in a coherent plan. You may say that’s my political preference.

        As it turns out this paper is a home run as far as I’m concerned. It allows much more useful political debate. And given the political realities I’m going to use it. I also hope others use it the same way.

      • Fernando, I believe you are basically correct on all points … however there are complications. First sea level rise is not well understood. It’s not at all clear whether the relationship between sea level and planetary temperature (whatever the hell that is) is mm per degree or meters per degree. That’s compounded by the fact that humanity has built a really inconvenient amount of infrastructure way too close to sea level to handle worst case weather conditions even if the level didn’t change at all.

        Yes, we’re going to run out of hydrocarbons eventually. But (hydro-electricity excepted) the technologies to replace oil, gas, and coal are stunningly immature and it seems to me that the difficulties in deploying them without major dislocations are not really appreciated. And while oil is getting expensive to extract, there are a lot of BTUs out there in gas, coal, tar, and oil shales that probably can be extracted at no greater cost than petroleum today.

        Another major problem is that the decision as to whether or not to burn all the hydrocarbons that can be gotten to is not going to be in the hands of those who think they are running the world. The decision will (and IMO should) be made by the leaders of China, India and the rest of the developing world, not the folks in the West who do all the pontificating. My guess is that in the long run, they will opt for improving their standard of living at the cost of dumping a lot of CO2 into the atmosphere.

      • With any luck, improved aquifers in the tropics and no war for the Arctic.
        ===========

      • Carrick, where to start debunking?
        A reservoir can also be a sink to start with.
        Next the giant ocean claptrap. yes the ocean contains a lot more mass than the atmosphere. Yes it heats up slowly , absorbs lots of CO2 and heat if there is spare and stores it for long intervals.
        But, it cannot put it out in increased amounts, it is in balance. If the CO2 levels fall or the world temperature falls It will fall less fast due to the oceans releasing some heat or CO2 to stay in equilibrium.
        It cannot suddenly produce new heat or new CO2 of itself, there is non too spare. You can have perturbations or currents that may temporarily be warmer or more CO2 laden but the difference is microscopic and temporary and never produces a rise in heat or CO2. It is not a furnace like the sun, it is merely a reservoir.
        Fine , hide your CO2 or heat in the vast ocean, it becomes infinitely small.
        Rabbit on about long tails,they are real but meaningless because they are so small.

      • Don K, I’m not sure it’s a good idea to debate fossil fuel issues in this particular thread. However, we could discuss it some other time.

        There’s no straight relationship between surface temperature change and sea level change due to transients within the ocean. I assume this is understood, but I’m not the best person to discuss it. Maybe Dr. Curry would give us a brief description of the problem as she sees it?

        I can’t come close to imagining anything to allow us to improve recovery factors beyond a few %. As for new targets….they are all very expensive. Did I tell you the first platform project I planned was designed to produce 400 million cubic feet of gas per day from 11 wells? We just don’t have many of those laying around like we did in the old days.

    • “Future solution designers should focus on two fundamental issues: one, if we keep adding greenhouse gases it´s likely to get warmer,”

      I just can’t see that as a bad thing, within the limits we seem to be establishing.

      • That’s right. In the other hand we share the planet with people who do worry. And one of them is Richard Tol. I happen to like his work. I also fail to see any limits established by anybody. I estimated CO2 concentration reaching 620 to 630 ppm. But that was from a limited volume of fossil fuels. I didn’t account for cement plants or methane and other gases. This means we do need to focus op on the details and try to solve the problems we face. And the solution can best be reached via political accommodation. A modern version of “you pledge support and I’ll give you a suitable title”. Who knows? We could give away Nobel Prizes and the Spanish King could name you “Duque de Poker y Parchis”.

  7. Pingback: Significant new paper by Nic Lewis and Judith Curry lowers the range of climate sensitivity using data from IPCC AR5 | Watts Up With That?

  8. What is de best estimate for equilibrium time? Wasn’t that something in the range of 150 to 200 years, which would mean that effectively for policy use in this century we simply can use the transient response?

    • Hans,the models suggest it’s more like 2000 years (most driven by the response time of the deep oceans, due to their very slow overturning rate). See Figure 6 of this paper to get an idea

      Keep in mind the estimates for the half-life of CO2 emissions is on the order 800 years (based on correlational studies), so even if we stopped increasing CO2

      If you haven’t seen it, this discussion by Isaac Held is worth a read. A more mathematical discussion can be found here.

      • Ah you assuming that the sinks are saturating, but that is not observed, actual half-life is 55 years. http://www.john-daly.com/carbon.htm

      • Carrick
        “Keep in mind the estimates for the half-life of CO2 emissions is on the order 800 years (based on correlational studies)”

        I’m not sure that is supported by good observational evidence. Gloor et al (2010) () estimate a half life of ~30 years for CO2, and find an exponential decay model with unvarying time constant fits the data. See also Schwartz’s 2010 AGU poster, here: , which obtains a similar result.

      • Estimating the persistence of CO2 in the atmosphere is not easy as summarized in the 2013 paper of Joos et al .

      • I get 30ish years for t half
        Makes sense if falling organic matter is the major carbon flux

      • Hans, no I’m not assuming that the sinks (or not-atmospheric reservoirs) are saturated. My comment was based on looking at the long term correlation between temperature and co2 level, based on ice core measurements.

        This observation is however motivated by the fact that the maximum diffusion time for CO2 in the oceans is governed by the time constant associated with deep overturning, which is a number between 500-1000 years.

        Nic and Pekka, I would also caution about the difficulties in estimating the persistence of CO2 in the atmosphere from direct measurements, as long as you have processes with latencies that are much longer than the observation period.

        [ I think there is a similar issue with estimating ECS from the available temperature data.]

        There is a lot more I can add here, but I don’t want this to turn into a tl;dr.

      • Carrick, if you believe that paleo-CO2 changes are driven chemical equilibria, then you will just believe that CO2 is sucked out of the air when the sea cools.
        However, this is a biotic planet, not a chemical one. the CO2 didn’t disappear from the atmosphere because of rock weathering, but due to mineralization of biotic matter.

      • A more mathematical discussion can be found here.

        Um no the mathematical argument (almost surely) is conceptually different eg Ruzmaiken.

        Linear and non-linear systems respond differently to external forcing. A classical example of a linear system response is the Hooke’s law of elasticity that states that the amount by which a material body is deformed is linearly proportional to the force causing the deformation. Earlier climate change studies used this linear approximation to evaluate the sensitivity of the global temperature change caused by external forcing. However the response of non-linear systems to external forcing is conceptually different; the issue is not a magnitude (sensitivity) of the response. Non-linear systems have internally defined preferred states (called attractors in mathematics) and variabilities driven by residence in the states and transitions between them. The question is what is the effect of an external forcing: change of the states, residence times or something else?

        Answer to this question is critical to our understanding of climate change. Based on the model studies mentioned above we can formulate the following, updated conjecture of the climate system response to external forcing: external effects, such as solar, the QBO and anthropogenic influences, weakly affect the climate patterns and their mean residence times but increase a probability of occurrence of long residences. In other words, under solar or anthropogenic influence the changes in mean climate values, such as the global temperature, are less important than increased duration of certain climate patterns associated say with cold conditions in some regions and warm conditions in the other regions

      • One cannot use a single half life or decay time to describe the decrease in CO2 mixing ratio if emissions cease because their are multiple processes at work. Archer has several articles on this, but for a quick summary, there is a comment by Ken Caldeira

        “About 50% of a CO2 increase will be removed from the atmosphere within 30 years, and a further 30% will be removed within a few centuries. The remaining 20% may stay in the atmosphere for many thousands of years.” But if cumulative emissions are high, the portion remaining in the atmosphere could be higher than this, models suggest. Overall, Caldeira argues, “the whole issue of our long-term commitment to climate change has not really ever been adequately addressed by the IPCC.”

        Schwartz, of course, misses the point completely. Since they are looking at short time responses, Gloor and company don’t consider it at all.

        Eli thinks that if you have to use a single function to describe the processes, a stretched exponential might not be bad.

      • Too many rabbits to get them all at once
        Eli Rabett | September 24, 2014
        “About 50% of a CO2 increase will be removed from the atmosphere within 30 years, and a further 30% will be removed within a few centuries. The remaining 20% may stay in the atmosphere for many thousands of years.”
        And I thought you knew Maths?
        lets do %steps of 30 years 50, 25, 12.5, 6.25, 3.125, in 150 years
        add em up 96.875% gone in 150 years by that assumption alone
        Note mans piffling contribution to turnover yearly is basically all gone in 5 years.

        Carrick
        “Keep in mind the estimates for the half-life of CO2 emissions is on the order 800 years (based on correlational studies)”
        niclewis | September 24, 2014 at 3:00 pm |
        I’m not sure that is supported by good observational evidence. Gloor et al (2010) () estimate a half life of ~30 years for CO2
        Carrick why do you keep doing this to yourself, a good argument has no refutation possible, where refutations exist stop pushing the wheelbarrow and think.

      • > And I thought you knew Maths?

        And I thought knew that CO2 was not a mathematical entity?

      • > I’m not sure that is supported by good observational evidence.

        And God said, “Let there be literature reviews.”

        God blessed them and said, “Be fruitful and increase in number; fill the earth and make independent researchers feel less unsure.”

      • DocMartyn, to be clear, I’m not discussing sequestration (carbon sinks) but carbon reservoirs. The oceans are by far the biggest reservoir, and it has a very long time constant associated with it. If we stopped generating CO2 emissions today, the rate at which the oceans would return their excess CO2 into the atmosphere is governed by the overturning rate of the deep ocean, which as I said is roughly 500-1000 years.

        The point is, were you to turn off CO2 emissions, you’d see a rapid decline, followed by a long tail. If you have a short burst of CO2 emissions, not much makes it into the deep ocean, and the presence of the long tail stops being of interest from a policy perspective. The longer the forcing, the larger the tail and the longer it will take the climate system to return to its pre-fossil fuel forcing.

        Eli, we are on the same page here.

        angech:

        I think you need to reread what Eli said, this time with an open mind.

        I’m not sure that is supported by good observational evidence. Gloor et al (2010) () estimate a half life of ~30 years for CO2

        The problem with this type of measurement, is that you are only going to see responses of the short-latency components of the system. I addressed this here:

        Nic and Pekka, I would also caution about the difficulties in estimating the persistence of CO2 in the atmosphere from direct measurements, as long as you have processes with latencies that are much longer than the observation period.

        If you want to look at the long-latency components, you need to use much longer time windows.

        It is possible to do this with ice core data, and what is found is the maximum correlation extends out to around 800 years or so:

        https://dl.dropboxusercontent.com/u/4520911/climate/CO2/gisp2-CO2-vs-DO18.pdf

        Focusing on short-period measurements is a bit like dropping your keys at night and then only searching under lamp-posts. You’ll only see short-period responses.

      • Here’s a jpg version of that figure.

        https://dl.dropboxusercontent.com/u/4520911/climate/CO2/gisp2-CO2-vs-DO18.jpg

        I wouldn’t take the “blue bands” seriously: I made no effort to correct for autocorrelation, which is large.

      • stevefitzpatrick

        Carrick,

        I don’t have any problem with the fact that there are many time frames over which atmospheric CO2 would respond if emissions were to stop, though I think there is far more uncertainty in the estimates of response over time than is usually acknowledged, and that people with ‘agendas’ consistently discount the response times that do not support their policy positions.

        But I think it best to not lose sight of one pretty clear implication: You don’t need to eliminate CO2 emissions for atmospheric concentrations to start dropping, and the higher the atmospheric concentration reaches, the less emissions need to drop to see falling atmospheric concentration. A ~45% reduction in CO2 emissions today would roughly stabilize CO2 levels for a few decades (or more). This is the main reason that I think projections of extreme atmospheric concentrations (say >650 PPM) are implausible; there just is not enough economically recoverable fossil fuel available to maintain 650 PPM in the atmosphere for very long, never mind go much over 650 PPM.

        There will be a modest very long term influence of the “pulse” of CO2 from the fossil fuel era, but considering the capacity of the ocean to absorb CO2, atmospheric CO2 concentration over ~350 PPM for thousands of years seems to me very unlikely.

      • Steve, I generally agree with your comments here. Just a few points to add:

        • I don’t see any evidence “noble cause corruption” in the physical climate groups that are investigating the question of atmospheric CO2 persistence.

        • The magnitude of the long-latency tail depends upon how much CO2 is placed in the atmosphere and on the profile for the eventual stopping of CO2 emissions as fossil fuels are depleted. [The longer CO2 levels remain high, the larger the long-lantency tail is.]

        • We don’t know whether there will be a baseline shift in equilibrium CO2 levels. [I think there are good reasons to expect one.]

      • Carrick, you want to do an ATL post on the kinetics of carbon fluxes into reservoirs and into mineralization (true) sinks?

      • “Eli thinks that if you have to use a single function to describe the processes, a stretched exponential might not be bad.”

        So that’s what you call it. I was calling it a “Modified Exponential Decay Curve.”

        Thanks!

        https://sites.google.com/site/climateadj/cmip5-tas-emulation

      • Perhaps one way to look at this is that the anthropogenic addition time-scale is currently 1% per year, or 100-year time scale. Clearly natural absorption is not keeping up with this, but can reduce it by half, so maybe its time scale is 200 years.

      • Can it be coincidence that the 800 year half life is approximately the same as the 800 year lag of CO2 after temp rise? Yes, it can!
        ====================

    • Hans, there is no ‘best’ time frame that I could find in writing the Sensitive Uncertainty essay formthemupcoming book. Hansen argues for 1000 years, with only 40 percent in the first 5 years and 60 percent in the first century. So a tiny thing now is still very scary then. The big unknown has been ocean thermal mass- how fast it equilabrates. Thermohaline circulation, and all that.
      These new findings suggest over 65% of the total effect is seen in about 10 years.

    • Well ang, you were wrong.

      Eli.

    • angech | September 25, 2014 at 10:56 pm |

      Carrick, where to start debunking?
      A reservoir can also be a sink to start with.
      Next the giant ocean claptrap. yes the ocean contains a lot more mass than the atmosphere. Yes it heats up slowly , absorbs lots of CO2 and heat if there is spare and stores it for long intervals.
      But, it cannot put it out in increased amounts, it is in balance. If the CO2 levels fall or the world temperature falls It will fall less fast due to the oceans releasing some heat or CO2 to stay in equilibrium.
      It cannot suddenly produce new heat or new CO2 of itself, there is non too spare. You can have perturbations or currents that may temporarily be warmer or more CO2 laden but the difference is microscopic and temporary and never produces a rise in heat or CO2. It is not a furnace like the sun, it is merely a reservoir.
      Fine , hide your CO2 or heat in the vast ocean, it becomes infinitely small.
      Rabbit on about long tails,they are real but meaningless because they are so small.

  9. The problem with the basic assumption in this paper is that there is no reason to assume that the 77 -97 rise is due to anything other than an approach to a peak in the 1000 year solar “activity” periodicity. The IPCC models are inherently useless as forecasting tools. For a complete discussion of this and an updated forecast of the possible coming cooling based on the natural 1000 year and 60 year periodicities in the temperature data see
    http://climatesense.norpag.blogspot.com
    As to climate sensitivity we have no good ideas of what it is -. This is in fact the IPCC position.
    By AR5 – WG1 the IPCC itself is saying: (Section 9.7.3.3)
    “The assessed literature suggests that the range of climate sensitivities and transient responses covered by CMIP3/5 cannot be narrowed significantly by constraining the models with observations of the mean climate and variability, consistent with the difficulty of constraining the cloud feedbacks from observations ”
    In plain English, this means that the IPCC contributors have no idea what the climate sensitivity is. Therefore, there is no credible basis for the WG 2 and 3 reports, and the Government policy makers have no empirical scientific basis for the entire UNFCCC process and their economically destructive climate and energy policies.
    The whole idea of a climate sensitivity to CO2 (i.e., that we could dial up a chosen temperature by setting CO2 levels at some calculated level) is simply bizarre because the response of the temperature to Anthropogenic CO2 is simply not a constant, and will vary depending, as it does, on the state of the system as a whole at the time of the CO2 introduction.

    • Dr. Norman Page

      The link:

      http://climatesense.norpag.blogspot.com

      Did not open to a resource.

      “The whole idea of a climate sensitivity to CO2 (i.e., that we could dial up a chosen temperature by setting CO2 levels at some calculated level) is simply bizarre because the response of the temperature to Anthropogenic CO2 is simply not a constant, and will vary depending, as it does, on the state of the system as a whole at the time of the CO2 introduction.”

      If you do have a link, I would like to read it.

      • Dr. Page,
        I have been trying to find out more about the eccentricity cycle and this is a big help. My understanding is that we are currently in a near circular orbit. My question is simple. How long (years) before we go into the beginning of a more eliptical orbit? Then how long until it reaches a maximum ellipse? Is that something that can be predicted or approximated?

      • Ordvic,
        The orbital parameters can be calculated accurately over millions and even tens of millions of years.

        The eccentricity is, indeed presently small, but it will get even smaller over the next 20000 years. Wikipedia is a good enough source for this

        http://en.wikipedia.org/wiki/Milankovitch_cycles

      • Pekka,
        Thanks, I have read that before but I didn’t know whether we were at the beginng, middle or end of the circular orbit. If as you say it will get smaller over the next 20,000 years that sounds to me like we are at the beginning. I thought we were more toward the middle and it would be something like another 10,000 years before it goes more elliptical. I may have the wrong idea altogether as I thought the circular orbit was about 1/5 of the duration of some form of the elliptical orbit (short or wide). I’ll be reading the other links and the mathmatics, I already glanced at it previously, but it takes me a long time to wade through the mathmatics.

      • Mathematics

    • Dr. Page, the assumption is not a problem. It is used to hoist the IPCC AR5 on its own petard. No wriggling off. See a just posted comment upthread.

      • Rud Istvan – Thanks for putting it so clearly. But we now have an extraordinary level of indirection, and no clear idea of what ECS actually is, or whether it even exists. As Judith says “there was ‘something else’ going on in the latter 19th and early-mid 20th century that was causing warming, that does not seem to relate directly to external forcing”. Until we have a reasonable idea of what that “something else” was, and what certain other “something elses” were (ie, what caused earlier warm and cool periods), we still do not know enough to estimate ECS.

        Yet the paper has value, provided its premise is understood.

    • Ordvic
      See the Q day plot in Fig 4 at
      http://climatesense-norpag.blogspot.com
      which shows the combined effect on insolation of the Milankovitch cycles at 65 N.
      Note on the eccentricity ( green curve )we are in a similar position to the interglacial of about 400,000 years ago. This cycle is very stable and has been seen back as far as about 400 million years.

  10. The usual suspects will be desperate to find a major flaw in the paper. If they don’t, it’s a real turning point. I think some sensible people may then find it to be a useful reason to back down from some silly positions they find themselves taking.
    Good luck, Judith.

  11. More context:

    Publishing Open Choice involves an open access publication fee of US$ 3000/EUR 2200 (excl. VAT). You can choose to pay by credit card or to receive an invoice.

    The open access publication fee does not replace any existing journal policies publication costs to be paid by the author, which are billed separately (e.g. surcharges for color in print, oversized articles, etc.)
    Customers providing payment from the Americas will be charged in US$ sales tax will be charged if applicable. Customers providing payment from Europe, Africa, and Asia will be charged in EUR. VAT is not included in the price and will be added, at a standard rate, if applicable.

    http://www.springer.com/gp/open-access/springer-open-choice

  12. Judith, will you update the climate sensitivity every year as the hiatus continues?

    • Don’t assume the pause will continue next year. This coming el Nino, could end up moderate in strength. That said, any pause in the pause is likely to be temporary…

    • get the code, you can do it

  13. Curious George

    Thank you for debunking IPCC pseudo-science. Amazing how so many people get paid for knowing so little.

  14. How long will it take for the rest of the climate science community to get on board and recognize that CO2 climate sensitivity is much lower than the previously sanctioned “Official IPCC results” and on which the EPA is unwisely basing (obsolete AR4 Report version) its CO2 emissions control regulations? Climate science needs a reality check from other scientific disciplines when its favorite climate sensitivity metrics of ECS and TCR can only be computed from un-validated climate models and cannot be verified with physical data.

    Can anyone explain to me why the hypothetical ECS value from an unrealistic step function forcing of the climate, as computed from climate models, is an appropriate metric for the EPA to us in making a 300 year projection of AGW as required by regulatory rules? Why isn’t a TCR type of simulation, but instead using actual history and 200 year projected GHG levels in the atmosphere, that would produce results similar to a TCR simulation (at least for the AGW temp increase that would occur when the CO2 level is doubled) and would result in much less uncertainty than ECS(as assessed by climate model dispersions), a more appropriate metric for a 300 year forecast, since it takes the climate more than 1000 years to equilibrate to the hypothesized ECS value, and we have only uncertain methods to check the computed ECS value with actual physical data?

    The Right Climate Stuff Research Team of retired NASA scientists and engineers proposes a new metric, Transient Climate Sensitivity (TCS), that is the increase in global average surface temperature due to the actual atmospheric CO2 level history in the atmosphere when CO2 levels are doubled with respect to pre-industrial levels. This metric is similar to TCR in value and can be verified with physical data. It can be accurately bounded with available data, as atmospheric CO2 levels have risen about 40% since pre-industrial times (since 1850), and we have sufficient data to accurately estimate what TCS will actually be when atmospheric CO2 levels are doubled later in this century.
    http://www.therightclimatestuff.com/BoundingClimateSensitivityForRegDecisions.pdf

    Our Upper Bound for TCS, considering only the radiative forcing effects of CO2, is TCS < 1.2C. If we are continuing to have any natural warming since the Little Ice Age, that was obviously occurring before 1850 (very difficult to detect and separate from AGW in the HadCRUT4 data record since 1850), then the actual value of TCS would be lower than this Upper Bound of 1.2C.

    • Harold Doiron – “Can anyone explain to me why …”. No, because it isn’t, for the reason that you gave: AGW is “very difficult to detect and separate from” natural warming. “Very difficult” looks like an understatement.

  15. Congratulations!

  16. Judith Curry,

    Congratulations upon this publication. I have now seen it in three places so far!

    One statement by Dr. Norman Page (Geologist) said and I asked for a reference link which did not satisfy my curiosity, and I am not sure I had ever thought about or read about atmospheric CO2 in this same way:

    “the response of the temperature to Anthropogenic CO2 is simply not a constant, and will vary depending, as it does, on the state of the system as a whole at the time of the CO2 introduction”

    I can imagine regional differences. I wonder though if defining a climate sensitivity depending upon current conditions is possible or is implied?

    The statement by Dr. Page vaguely reminds me of Tsonis, synchrony, bifurcations and regime changes.

    Anyone else making such connections?

  17. Firstly congratulation to Dr. Curry and Mr. Lewis.
    I am not a scientist, and in addition not particularly versed in the CO2 sensitivity calculations, so my remark may not be relevant.
    Regarding the volcanic reference periods (see Fig.1):
    The AMO is a major contributor to the natural variability and it appears to be fairly responsive to the Icelandic volcanic eruptions. In 12 out of 23 years of the reference period 1859–1882.there vere eruptions (in 1867 two volcanoes Grimsvötn and Tjörnes). Similarly for 1995–2011 there were 9 eruptions (in 1999 Katla and Kolbeinsey Ridge).
    Consequently in my view using volcanic forcing data from AR5 may not be the best option.

  18. Steve Fitzpatrick

    Hi Judith,

    Congrats. Very nice paper.

    I was myself already using AR5 forcing estimates and heat uptake data to estimate ECS, using the 1850 to 2011 period. I got a most probable value of 1.55C/doubling, a 17% to 83% range of 1.41C to 3.27C/doubling, and a 5% to 95% range of 1.18C to 6.2C/doubling… not far from your values (but I assumed a little higher total heat accumulation, including deep ocean uptake equal to 10% of the 0-2000M value, and some additonal heat for ice melt and land mass warming). The median sensitivity I got was 1.97 C/doubling.

    One interesting point I noted (and your paper confirms) is that if you reduce the forcing uncertainty from the IPCC level, but don’t change the IPCC’s best estimate of forcing, the most probable value of ECS increases very slightly, but the high sensitivity tail (eg total probability for sensitivity above 3.5C per doubling) almost disappears. This points to the importance of narrowing the uncertainty in forcing to more accurately define the high sensitivity tail, and so better constrain which GCM’s generate plausible diagnosed sensitivities and which do not. The overall uncertainty is dominated by direct and indirect aerosol effects… and here there is a crying need for better data. If the forcing uncertainty could be reduced by 1/2, most of the model diagnosed sensitivity values would (I think) be clearly much too high.

    I suspect your paper will get some push back based on papers which claim there is a substantial difference (>~10-15%) between effective and equilibrium sensitivity (for example, Armour et al 2013), with effective sensitivity always lower than equilibrium sensitivity. My personal take is that the difference is probably quite small, and even if it is not, from a practical viewpoint, the effective sensitivity value is going to be a very good predictor of warming, at least for 100 to 150 years or so.

    • Gold
      “This points to the importance of narrowing the uncertainty in forcing to more accurately define the high sensitivity tail, and so better constrain which GCM’s generate plausible diagnosed sensitivities and which do not. The overall uncertainty is dominated by direct and indirect aerosol effects… and here there is a crying need for better data. If the forcing uncertainty could be reduced by 1/2, most of the model diagnosed sensitivity values would (I think) be clearly much too high.”

      before we spend trillions on mitigation, you’d think some effort here would be worthwhile

    • Matthew R Marler

      stevefitzpatrick: The overall uncertainty is dominated by direct and indirect aerosol effects… and here there is a crying need for better data.

      Why isn’t the overall uncertainty dominated by the uncertainties in the effects of land-use changes and natural variation?

      • Matthew R Marler

        oops, that should be Steve Fitzpatrick.

      • Give it time.
        ========

      • stevefitzpatrick

        Matthew Marler,
        The uncertainty I was talking about is the uncertainty in forcing, so ‘natural variation’ is not included. There is of course uncertainty associated with forcing from land use changes, but in the IPCC summary for policy makers, there is a bar graph which compares the estimated values for all kinds of forcing, along with their associated uncertainties. On that graph, uncertainty in the influence of land use is pretty small. Which is not to say that is for sure correct. The point is that using the IPCC’s own estimates of forcings and associated uncertainties, the estimated sensitivity PDF falls far below the ‘distribution’ of sensitivities diagnosed by GCM’s.

      • Matthew R Marler

        stevefitzpatrick(!): The point is that using the IPCC’s own estimates of forcings and associated uncertainties, the estimated sensitivity PDF falls far below the ‘distribution’ of sensitivities diagnosed by GCM’s.

        I agree with you there. It was a great idea, well carried out, to take the evidence from the IPCC AR5 and use it rigorously. Now that I have finished reading it in detail, I think that they did a good job.

      • I am not sophisticated enough to know what they did. But if the IPCC is spinning data, one may be able remove the spin.

  19. This is clearly a well thought out paper based on AR5 “evidence” and, therefore, not necessarily representing the “true” views of the authors.
    I am amazed at how estimates of climate sensitivity keep moving down towards the views of Professor Richard Lindzen.
    Cudos to Mosher for presenting views a simple soul like me can understand. Long may this continue.

  20. Excellent Paper. Congratulations.

    Thank you

  21. I just wish there was a reliable. unadjusted, historical temperature record.

    The use of HadCrut, specifically adjusted to give a warming trend, really makes all your hard work a bit, ummmm.. “non-robust”

    • Griss, you will really like the When Data Isn’t essay in the forthcoming Ebook, Blowing Smoke: Essays on energy and climate. Even Judith gave it a review wow, and that was before Dr Marohasy found Rutherglen (which is now in the book now at the publishers). Judith has provided the forward, since she has already guest posted all or part of 12 of them.

  22. Pingback: El último y mejor estudio ortodoxo sobre la “sensibilidad” del clima al CO2. Como la mitad de los alarmistas. | PlazaMoyua.com

  23. Pingback: El último y mejor estudio ortodoxo sobre la “sensibilidad” del clima al CO2. Como la mitad de los alarmistas. - Desde el exilio

  24. According to Dr. T. Ball, there’s a limit of at most 1.4 °C of temperature increase even if CO2 triples.

  25. There remains considerable meta uncertainty in the determination of climate sensitivity, including how the problem is even framed.

    I don’t read sensitivity studies – and this one is no exception. For 2 reasons. The first is that the critical constraint on attributing temperature change to forcing changes is simply not available.

    In the post war period we have had a complete cooling and warming regime to 1998. The temperature increase was some 0.4C. Assuming all of this was anthropogenic gives a transient sensitivity of about 0.8C. If 50% was anthropogenic – 0.4C. With the best available data and the best will – it merely masks ubiquitous uncertainty with spurious precision.

    Secondly – and more importantly – these ideas of sensitivity lack a fundamental theoretical justification. Climate sensitivity (γ) is variable. It is the change in temperature (ΔT) divided by the change in the control variable (Δμ) – the tangent to the curve as shown below. Sensitivity increases moving down the upper curve to the left towards the bifurcation and becomes arbitrarily large at the instability. The problem in a chaotic climate then becomes not one of quantifying climate sensitivity in a smoothly evolving climate but of predicting the onset of abrupt climate shifts and their implications for climate and society. The problem of abrupt climate change on multi-decadal scales is of the most immediate significance.

    http://watertechbyrie.files.wordpress.com/2014/06/unstable-ebm-fig-2-jpg.jpg

    Dynamic climate sensitivity implies the potential for a small push to initiate a large shift. Climate in this theory of abrupt change is an emergent property of the shift in global energies as the system settles down into a new, emergent climate state. The traditional definition of climate sensitivity as a temperature response to changes in CO2 makes sense only in periods between climate shifts – as climate changes at shifts are internally generated. Climate evolution is discontinuous at the scale of decades and longer.

    It is playing the game – Judy – by not challenging conventional ground rules – but you are not advancing understanding of the ‘meta uncertainty’ surrounding the theoretical framing of the problem.

    • Rob, you may be right. I certainly understand your points.
      But I think this paper, by ‘playing the game’ does something different and more immediately important. The U.S. has a president using extra legal means via the EPA to wage a war on coal. See my recent guest post Clean Coal. The UNFCCC is waging a big PR campaign leading up to Paris. All predicated on the ‘science is settled’. This paper takes the IPCCs newest and best estimates of T, Q, F to show the CMIP5 models got the most important estimates, those for sensitivity, wrong by almost half.

      How important the non-linear dynamic nature of climate is remains to be seen. I think less important than you do, but that is only an informed opinion for some other thread. And which can be researched in the future if sensitivity is low, without committing to drastic actions now.
      Nic and Judith’s paper is a direct frontal attack on the core IPCCS output, using their own best inputs. That is the kind of thing that can help stop the momentum OBama and Moon are trying to build. And explains the political decision for AR5 not to offer a best estimate. It would have killed the alarm meme necessary for Paris momentum.

      • ‘What happened in the years 1976/77 and 1998/99 in the Pacific was so unusual that scientists spoke of abrupt climate changes. They referred to a sudden warming of the tropical Pacific in the mid-1970s and rapid cooling in the late 1990s. Both events turned the world’s climate topsy-turvy and are clearly reflected in the average temperature of the Earth. Today we know that the cause is the interaction between ocean and atmosphere. Is it possible to successfully predict such climate shifts?’
        http://www.geomar.de/en/news/article/klimavorhersagen-ueber-mehrere-jahre-moeglich/

        Natural variability at work.

      • Good points, Rob and Rud. In terms of the policy debate, the Lewis & Curry paper might help to constrain bad policy while the deeper understanding which you seek, Rob, is pursued further. I’ve sent a letter to The Australian suggesting that “Australia’s politicians and policymakers need to revise their assessments in the light of these figures.”

      • Matthew R Marler

        Rud Istvan: Nic and Judith’s paper is a direct frontal attack on the core IPCCS output, using their own best inputs. That is the kind of thing that can help stop the momentum OBama and Moon are trying to build.

        I would avoid saying that Prof Curry has engaged in an “attack”, but except for the connotation, I agree with your point. I think that a good case can be made that they have computed a reasonable upper bound, using the best information provided by IPCC..

      • Rud gets the tactical approach that moshpit laid out long ago.

        You only make a difference by working from the inside

      • Tactics? Bah humbug. Science progresses one death at a time. Let the tumbrel roll.

      • Rob Ellison. one death at a time?
        your ideas are still born. nobody cares what you think.
        get a clue.

      • Mosher wrote:

        “You only make a difference by working from the inside”

        That really needed to be said. No one likes a mob at the gate. Be realistic, patience and adaptable; then opportunity arises. If not, move on. I found by being on the inside you can see the problems with the institution’s approach coming down the road and craft your response. Also sometimes the only way to get it done right is to let someone else carry the water.

        You are in very good form today Mosh.

      • …patient…

      • I’ll put this here as well. The origin of one death at a time is of course Max Planck talking about scientific truth.

        http://judithcurry.com/2014/09/24/lewis-and-curry-climate-sensitivity-uncertainty/#comment-632620

      • I care what Ellison thinks. The dynamical system description of climate with potential abrupt changes etc etc makes more sense than any other description of climate Ive run acrosst.

      • Everyone hears the elephant with different ears; some sense from out of the forest, even.
        =================

      • Matthew R Marler

        Rob Ellison: The origin of one death at a time is of course Max Planck talking about scientific truth.

        I know that. The tumbrils was your addition, as Planck did not write in favor of decapitating his opponents. Planck was not entirely correct: at least as often, the elders simply get left behind when science progresses.

    • You’ll like the next paper we have coming out, stay tuned post ready early next week.

      • I’m thankful for small mercies. I am laid up with a contact cast on my leg – until tomorrow hopefully – and pretty grumpy. I will look forward to your next paper as usual – even if I didn’t read this one.

        But if the use of science for political ends is the main game – as ammunition in the climate war – as Rud seems to be suggesting – then much is lost – as you are certainly aware.

      • The paper was not intended as ammunition in the climate wars. It was designed to clarify the sensitivity of sensitivity to uncertainties in external forcing, something that hasn’t been systematically done before.

        I remain very concerned about abrupt climate change, but I am also working to demonstrate that if you accept the IPCC framing of the climate change problem, e.g. ‘forced’, that models are over sensitive and the sensitivity is lower than inferred from climate models.

      • I fully accept that you intended no crossing of the line into science advocacy – and you are certainly not responsible for the meanings others attribute to it.

      • Dr Curry: Do the uncertainties addressed in your paper include the feedback uncertainties described by Dr Koonin? Perhaps I don’t understand the difference between feedbacks and natural forcing. And here’s hoping that his call for improved observation capabilities, some of which are not yet on the drawing board, come to be.

        Congratulations on the paper; It most likely will affect the debate.

        Richard

      • rls, most climate scientist also confuse feedbacks and natural forcings.

    • Rob, a separate point about your chaos thery tipping point thing.
      1. Your graph does not advance your cause, if the temperature range on your Y axis is supposed to be global something. That range of variation has not been experienced during the entire Pleistocene. If it had been, you and I would not be here having this conversation.
      2. If there are less extreme but none the less important climate tipping points, then all the climate tipping factors have to be considered. Not just fossil fuel emissions. Land use to take one. Forests and prairies have different albedo and transpiration than agricultural land. An appreciable part of atmospheric methane comes from animal husbandry. And so on. Any of those could also precipitate a tipping point. But there are no mitigating solutions given the planets population and living standards. Except to depopulate the planet. Even the UN won’t go there. An Ehrlich too far, so to speak. Some risks in life just are.

      • The model is a zero-dimensional energy balance model using physically based equations. It is a demonstration of the concept involving an abrupt transition to snowball Earth. The quantum of change is roughly correct for such an extreme transition.

        http://web.atmos.ucla.edu/tcd/PREPRINTS/Ghil-A_Met_Soc_refs-rev'd_vf-black_only.pdf

        To more realistically model the Quaternary – you would need other factors especially thermohaline circulation.

        The whole problem involves black carbon, methane, nitrous oxide, sulphur dioxide, CFC’s and tropospheric ozone – with CO3 as a significant part but less than half of the problem. Land use and population pressures play a part. Much of this can be addressed within rational development strategies focusing on energy, economic growth, health, education, safe water and sanitation, ecological restoration, building fertility in agricultural soils – a multi-objective approach to global progress this century.

        It is a matter of broadening the response in a way that in effect marginalizes the CO2 obsession.

      • Rob, no disagreements to your most immediate above post. But that also does point out the ‘wicked’ nature of the issue.

      • Rob, that makes me wish methane was studied more.

        Some one recently linked a “methane bomb” article. If the probability of the coming methane bomb was reasonable, I would think many of these events would have happened during deglaciations. Where are these in the paleo data? What were temp responses? What were biological responses?

        My guess is that there are only tiny signals left by these “bombs”–if they happen, which I would think they do– and that methane bursts don’t have the temperature response we would expect, nor the “half-life”. I would think that they would usually just barely be picked up.

        Probably water-vapor temporarily increases, aerosol methane consuming bacteria bloom and seed clouds and precipitation, and it would all rain out pretty quickly, fertilizing the surface. Maybe only showing as a blip in growth in the biosphere.

      • Rob, are you aware that quantum is generally used to describe very, very, small things like very, very small particles, distance and energy states and not, say, a planet that weight 6 time 10 to the 24 kilos?

    • I work with structural buckling which has similar bi-stable properties as you are showing. Theory shows a nice clean bifurcation when operating near the critical point but when one tries to reproduce it in the lab one observe a sloppy transition.

      Rule of thumb is nature doesn’t like to operate near a critical point and will leak energy to move away from it. Some other process not modeled will take over and move the system in unpredictable sloppy path.

      Might be wishful thinking but looking at history (ice core proxy) the climate seems to have a strong restoring mechanism that tends to like things cold. In spite all the positive feedbacks we are finding.

      • Depends on the material. Brittle materials will give catastrophic failure – which it is sensible to avoid. Flexible materials will bend and shed load to other members giving a progressive failure. If the load is sufficiently distributed – we can have a member failure without structural failure. This saves on some angst in structural designers.

        Engineering is very like being an officer and a gentleman – in failure there is the option of taking the honorable course.

        In climate we are talking about abrupt change in complex and dynamic systems. Deterministic chaos in other words.

        ‘What defines a climate change as abrupt? Technically, an abrupt climate change occurs when the climate system is forced to cross some threshold, triggering a transition to a new state at a rate determined by the climate system itself and faster than the cause. Chaotic processes in the climate system may allow the cause of such an abrupt climate change to be undetectably small.’ http://www.nap.edu/openbook.php?record_id=10136&page=14

        And my favorite example in ENSO. Blue dominant to 1976, red to 1998 and blue again since.

        http://www.esrl.noaa.gov/psd/enso/mei/ts.gif

        Cheers

    • Rob, I’m certain you’re right. I’ve always thought the same.

      But this paper is important in that it leads toward the paradigm shift in thinking that you hoping for.

      The paper shows sensitivity changes over time and it is generally low, especial in the recent period of exceptionally high emissions and concentrations. Sure that might change, but it in the far end of uncertainty that is way beyond quantifiable (especially on meaningful timescales to us). Plausible in the sense that nothing is certain, anything is possible and flying monkeys might climb out of you’re arse while you read this.

  26. When will the IPCC’s corrections to previous estimates based on, “evidence from new studies of observed temperature change, using the extended records in atmosphere and ocean,” reflect the fact that GCMs predict the atmosphere warms faster than the surface but it’s the opposite?

  27. “Mere mortals” assume that “doubling of the atmospheric CO2 concentration” starts at the current concentration of ~400 ppm and ends a 800 ppm. It might be wise to put “doubling” into proper context using the pre-industrial amounts as the starting point in every reference.

    • Heh, let’s use pre-industrial temps, too. Let’s see, pick a number between 1 & 10.
      =================

    • Considering the climate’s pretty good right now at 400 ppm, I think it is fully reasonable for us proles to assume the doubling starts at 400, your Highness.

      • As one of my minions, “your Highness” wishes you all the best in your life on this planet. In the mean time, I hope that the starting point for doubling CO2 is 280 ppm, but that may be open for discussion. At 400 ppm, 560 ppm isn’t too far away. The climate is certainly exciting, I will give you that point.

    • Oh, yeah. Just reminding people how cold we’d be without AnthroCO2.
      ===========

      • You jest, Kim, but if we stop producing CO2, we damn well could plunge into another ice age! You just don’t know. It’s, well, it’s very uncertain. It’s better to risk warming that cooling. We don’t want our Chinese goods in the US delivered by truck, do we???!!!

      • Let’s apply the precautionary principle and opt for risking warming instead of cooling. Rational choice, that.

      • Seems obvious. Someone should graph this anthropomorphic blip, this anachronistic aliquot, of fossil carbon against the totality of solar energy flow to the Earth. Weak, and not enough.
        ============

  28. Like with the Bose-Einstein statistics fiasco, these deniers don’t have a clue about statistical mechanics, continuity equations, or transport theory. webnutcolonoscope

    The land surface temperature record reflects a balance of kinetic and latent energy which changes with water availability. The land/ocean contrast is obvious but he invests it with a significance it simply doesn’t have.

    He solves climate with a single line of algebra – a grossly superficial approach using assumptions that lead to a predetermined conclusion. Superficial and misguided. And he calls it science – without acknowledging that other – if equally uncertain and misguided – science exists. A rational actor would incline to think that we have been mugged in a dark alley by the uncertainty monster. I tend to think that the mug is webnutcolonoscope.

    And the Bose-Einstein fiasco is webnutcolonoscope. He insists he knows something but of course refuses to define and was MIA – presumed incompetent – in the relevant post.

    When will we be free of this monster of misinformation?

  29. I don’t think the climate is some sort of duchess or metrosexual who sits around being sensitive to our impertinent emissions.

    Just think of what climate can do when El Nino turns central Australia to powder then blows it west as a Big Dust every decade or so, like in 1983 and 2009. It makes iron soup in the Pacific!

    You think the climate was just sooking and annoying Aussies with all those dust clouds in the mid-1940s? It was taking big action. Climate action, for sure; and no head-tilting hipsters and cranky grannies with protest signs were required. Imagine how all the new phytoplankton gobbled that CO2.

    Things were turned around by 1950: the ocean came to us in the form of massive rains. While we were trying to keep afloat the climate was no doubt planning its next Big Dry and next batch of iron soup.

    Sensitive? Nah. Other words needed. Tricky and responsive, a Ulysses, that’s your climate.

  30. Matthew R Marler

    from the pdf: Using a global energy budget approach, this paper seeks to understand the implications for climate sensitivity (both ECS and TCR)
    of the new estimates of radiative forcing and uncertainty therein given in AR5
    .
    This approach avoids to a substantial extent the dependence on AOGCM
    simulations in previous energy budget studies (e.g. Otto et al. 2013)
    .
    Further, we refine the energy budget methodology for determining climate sensitivity to minimize the impact of natural internal variability on the estimate of climate sensitivity. And finally, we account carefully for the impact of uncertainties in forcing, ocean heat uptake and surface temperature on the determination of climate sensitivity. The paper is structured as follows. The global energy budget approach is discussed in Section 2. Section 3 deals with data sources and uncertainties, Section 4 with choice of base and final periods, whilst methods are described in Section 5. Section 6 sets out the results, which are discussed in Section7

    I have 3 questions.

    1. What is the reason for assuming that TCR is the same going forward as it has been getting here from where the Earth was? couldn’t it be higher or lower due to some known unknowns (cloud cover, methane tipping points etc)?

    2. Say that CO2 doubles by about 2150 — how long before the climate has changed 95% of the way, at the surface and lower troposphere, from where it is now to its equilibrium?

    3. As the temperature increases, the water vapor pressure (hence by inference the water evaporation rate on non-dry surface) increases supralinearly; that is, a 1K increase from 288 K is much less than a 1K increase from 308K. Can you account for the increase in evaporation (and probably precipitation) as the Earth warms?

    The paper looks good. Now I shall read it in detail. If you did address those questions in the text, I apologize for not seeing so when I skimmed it.

  31. It would be rather nice if someone (come on Mosher, Stokes) could reconstruct the Earths temperature after the CO2 signal has been removed, using the most likely value for TCS/ECS and F Lewis and Curry identify.

    • Nice to see you here again. You get a big shout out in the forthcoming essay Sensitive Uncertainy about guess what. Hope you like the overall, because you are placed in the sensitivity pantheon just next to Guy Callendar. Makes you VERY prescient.
      Highest regards

  32. Dr. Steven E. Koonin recently remarked, in his great WSJ essay
    http://online.wsj.com/articles/climate-science-is-not-settled-1411143565 “Climate Science Is Not Settled,” that

    “Today’s best estimate of the sensitivity (between 2.7 degrees Fahrenheit and 8.1 degrees Fahrenheit) is no different, and no more certain, than it was 30 years ago. And this is despite an heroic research effort costing billions of dollars.”

    Good to see you two answering this problem, and on a considerably lower budget!

    Cheers — Pete Tillman
    Professional geologist, amateur climatologist

  33. Well this should finally settle it, ha ha. That sound you heard was a few of the usual suspects heads exploding.

  34. Lets start with the whole equation. There are skeptics who object to the entire IDEA of this equation. The best example is Willis. There are other types of objections, but at the bottom they all object to the notion of capturing , describing, characterizing, the complex system of the climate with a simple equation. They will never get much of a hearing. In the end the equation will either do a good job or not. in other words, I don’t think “systematic” skeptics have much of a role to play in the debate. They are outside the conversation. To be invited to this debate you have to accept, EVEN IF ONLY PROVISIONALLY, the notion that sensitivity is a meaningful metric. Moshpit

    It’s my party and I’ll decide you get dressed up to the nines? One has to figure that an increase in 40ppm of CO2 and no surface temperature increase over more than a decade is prima facie evidence that the ‘formula’ is far too stupid to be meaningful. There is a role – he invites it or not – to insist that Emperor Moshpit has no clothes.

    • Note. Nobody cares what you think.
      Nic on the other hand…. Makes a difference.

      • Note – you are still hopelessly muddled. Addressing a more fundamental reality – the naked Moshpit – the inadequacy of the framework – is of far more significance than transient political utility in the longer term. Science trumps politics one would hope – although the prospects look dim at this time.

        And frankly – the chances of this – or the Moshpit – making any difference at all in the politics is remote.

      • It’s just a form of argument. You state that taking all their assumptions to be correct this is the answer derived. There is no need to be inside the box or even pretend to be inside the box. You can even clearly state that you don’t think their assumptions are even close to being correct and yet even if they were they are still wrong.

      • thank you steven.
        There was an opportunity for someone of Rob’s talents to make a mark.
        Sadly he missed it.

    • Matthew R Marler

      Rob Ellison: One has to figure that an increase in 40ppm of CO2 and no surface temperature increase over more than a decade is prima facie evidence that the ‘formula’ is far too stupid to be meaningful.

      You might be correct, but the Lewis and Curry paper is written for those people who do believe that the formula is meaningful (for example, the people who believe that the short-term oscillations have essentially balanced out over the observation interval, a point addressed by the authors), and that the data summaries in AR5 are meaningful, and it shows them what you get when you use them as rigorously as possible.

      • I see – a polite fiction for believers? Like the Emperor Moshpit’s new suit?

      • Matthew gets it too.

      • Matthew R Marler

        Rob Ellison: I see – a polite fiction for believers? Like the Emperor Moshpit’s new suit?

        One opinion at a time, not one death at a time. Some of the opinions respond better when you start out speaking their language.

      • ‘A new scientific truth does not triumph by convincing its opponents and making them see the light, but rather because its opponents eventually die, and a new generation grows up that is familiar with it.’ Max Planck

        Or as someone paraphrased it – science advances one funeral at a time.

        The lack of recognition of an allusion to scientific paradigms is a bit odd. Reframing the issue around the new climate truth was what I was discussing.

        The mad Emperor Moshpit misses by a mile – but there may be hope for Matthew.

      • Matthew, Rob may be correct, Steven’s hyped up attack suggests he is certainly scoring big points.
        Not being mathematical in the league of these guys but using common sense Rob is saying Steven’s formula if correct, is not working.
        The formula is right, the answer right, the Climate sensitivity must be miles lower!.
        Steve knows this, he is not stupid (just colourful), but does not want to get offside with his mate. Hence he resorts to insults which help stop him addressing this salient point.
        Note in a previous discussion Steven, a Luke warmer, passionate about saving the planet , said to me that the longer the pause goes the lower the climate sensitivity would be and did not rule it out going under 1.6 .
        Heresy !
        Way however writes papers with Cowtan which state the non scientific nonsense that points that are further apart are more important than adjacent points (NB only when the close points disagree with your Kringing data, deliberate misspelling, and need to be removed, which was duly done).

  35.  Climate  Scientist

    You will never be able to calculate “sensitivity” when the energy diagrams are so wrong.

    We don’t “have control, influence, or impact on the climate” for one key reason. The gravito-thermal effect (first explained by the brilliant 19th century physicist, Josef Loschmidt, and never correctly disproved by people like Robert G.Brown of WUWT fame) has been overlooked.

    All the energy diagrams have major flaws:

    (1) They imply that solar energy absorbed by the surface comes back out of the surface in the same region, thus playing a part in determining local temperature. That is simply not the case for more than half the surface which is the thin surface of the oceans in non-polar regions. That surface is hotter than the floor of the ocean, and so there is significant downward diffusion of thermal energy which then does not surface again until it reaches the polar regions. Furthermore, most of the solar radiation passes right through that thin transparent layer, warming lower regions in the thermocline from where the energy continues its downward trend.

    (2) Back radiation only slows that portion of this ocean surface cooling which is by upward radiation. It does not slow evaporative cooling or upward conduction, diffusion and convection. Nor does it have any effect on the cooling caused by downward diffusion to the depths of the ocean in these non-polar regions where nearly everyone lives on land that is affected by nearby ocean temperatures. Nor does back radiation help the Sun to raise the temperature in the first place, as is implied in the way climatologists use the Stefan-Boltzmann Law.

    There is obviously a huge amount of “missing energy” that must be entering the ocean surface. There is indeed, and it comes from downward diffusion (“heat creep”) which is restoring thermodynamic equilibrium, just as the Second Law of Thermodynamics says will happen. The energy diagrams don’t show this.

    • Climate Scientist,

      The gravito-thermal effect obviously explains why the water at a depth of 10 kms is warmer than that at the surface. It’s all due to the effects of gravity.

      This, of course, depends on you blindly accepting that 4C at the bottom is hotter than 25C or so at the surface. Or maybe water is affected by a special Cotton type of cooling gravity, which affects rocks differently causing them to warm.

      Or maybe there is precisely no gravito-thermal effect, and Loschmidt was as wrong about it as Arrhenius was about CO2 heating the Earth.

      The Earth is still cooling – just as surely as your warm cup of coffee. Try to stop your coffee from cooling by surrounding it with CO2. Let me know how you get on.

      Live well and prosper,

      Mike Flynn.

      • Coffee on a hotplate – not boiling – of course will reach an equilibrium temperature dependent on the energy input and the temperature of the surrounding CO2.

      • Rob Ellison,

        You wil have noted I did not mention a hot plate. Like AFOMD, you have chosen to provide an irrelevant comment, presumably in an attempt to justify the “CO2 warms stuff” nonsense.

        If you believe you can either stop something cooling, or cause it to warm, by surrounding it with CO2, keep believing. Don’t be discouraged just because you can’t actually do it. Neither can anybody else.

        Good luck. Sir Isaac Newton believed in Alchemy, so you are in good company believing in that which cannot be verified experimentally.

        Live well and prosper,

        Mike Flynn.

      • Your denial that there is a hotplate is both odd and irrelevant. There is of course a hotplate at the surface of the planet that is heated by SW electromagnetic radiation.

        The IR radiation that is subsequently emitted interacts with carbon dioxide in the atmosphere – a basic reality of experimental physics that is most certainly seen in absorption spectra. That an increase in CO2 in the atmosphere leads to an increase in energy in the atmosphere is an inevitable consequence of statistical mechanics.

        Good luck maintaining the fiction that statistical mechanics is alchemy. I am however quite indifferent to your fantastic struggles with scientific reality.

      • Matthew R Marler

        Mike Flynn: You wil have noted I did not mention a hot plate.

        Exactly so: you always omit reference to the continuous input of energy into the climate system from the sun.

      • Rob Ellison,

        Your contention that the Sun’s warming of the Earth’s surface is equivalent to a hot plate under a cup of coffee is both silly and misleading. Silly, in the sense that the Sun is absent at night, and also that the influence of the Sun has been unable to stop the planet cooling to its present temperature.

        Maybe you meant a hotplate with a maximum temperature of 85C, turned off for 50% of the time. Cold coffee, indeed.

        Misleading, inasmuch as the concept of a hot plate assumes an external heat source capable of maintaining an object sitting upon it at a constant temperature elevated above ambient, where radiation absorbed is equal to radiation emitted. The Earth exhibits a net loss of energy at all times. Real scientists refer to this as cooling, faux scientists and Warmists call this Warming.

        Once again the desperate Warmist attempt to introduce irrelevant and misleading analogies in place of non existent experimental verification of an effect which does not exist.

        You might care to use your vast scientific knowledge, combined with your demonstrated ability to refer to research, to provide a link to experimental verification that it is, indeed, possible to prevent an object cooling by surrounding it with CO2. Or you might prefer to unleash another diatribe of unsubstantiated assertions – or handwaving if you prefer.

        I commend Michael Mann, Nobel Laureate, to you, as an example you might care to emulate.

        Live well and prosper,

        Mike Flynn.

      • Mike:

        There’s a reason that man-made satellites undergo thermal testing in a vacuum chamber whose walls are cooled by liquid nitrogen — it’s what’s necessary to simulate the conditions of space. Of course, the vacuum stops conductive/convective losses; drastic cooling of the walls virtually eliminates the “back radiation” that would occur at earth ambient temperatures.

        Your cup of coffee would cool faster (or with a steady power input, would have a lower steady-state temperature) if there were no radiatively active gases above it.

      • Mathew R Marler,

        If you notice my response to Climate Scientist, I challeged his assertion that the gravito-thermal effect exists. I also stated the Earth is still cooling.

        Talk of coffee pots and hot plates is purely a Warmist diversion. CO2 no more prevents the Earth cooling than it can prevent anything else cooling. I believe this is fact, and I welcome experimental verification to the contrary.

        I am reasonably sure you haven’t any, neither has any other Warmist.

        The Sun’s radiation is intercepted by the Earth only on the side facing the source of the radiation. Every portion of the Earth’s surface emits radiation continuously, dependent on the temperature and emissivity.

        Overall, a net loss.

        Speak to a geophysicist or similar. Alternatively, that noted Distinguished Professor and Nobel Laureate, Michael Mann may agree with you, while he waves a hockey stick or other wooden object around.

        Keep on believing, keep on praying – miracles might eventually occur. Who knows?

        Live well and prosper,

        Mike Flynn.

      • Curt,

        I appreciate what you say. Howeve, you don’t seem to have read what I wrote.

        You wrote –

        “There’s a reason that man-made satellites undergo thermal testing in a vacuum chamber whose walls are cooled by liquid nitrogen — it’s what’s necessary to simulate the conditions of space. Of course, the vacuum stops conductive/convective losses; drastic cooling of the walls virtually eliminates the “back radiation” that would occur at earth ambient temperatures.

        Your cup of coffee would cool faster (or with a steady power input, would have a lower steady-state temperature) if there were no radiatively active gases above it.”

        Apart from the usual Warmist irrelevance of the first paragraph, may I respectfully point out that the temperature of liquid nitrogen is nothing like the conditions in outer space. The temperature of liquid nitrogen is quite high by comparison. In fact, the major heat problem with man made satellites – at least the inhabited ones, and including EVA suits – is overheating. But it is, as I said, merely an irrelevance.

        As you state, a cup of coffee will cool faster when uninsulated. It still cools when insulated, just more slowly. Your comment about radiatively active gases is merely another Warmist red herring. All gases are radiatively active. Yes, all! If it were otherwise, the gas would have no temperature, as this is a measure of radiative activity. Now is the time for you to tell me that Einstein, Feynman, and all the rest don’t really understand the complexities of Climatological radiation. Pardon me, whilst I snort with derision.

        You are still unable to heat anything by surrounding it with CO2. Sure, it will cool more slowly when insulated, but cool it will.

        Live well and prosper,

        Mike Flynn.

      • Your contention that the Sun’s warming of the Earth’s surface is equivalent to a hot plate under a cup of coffee is both silly and misleading. Silly, in the sense that the Sun is absent at night, and also that the influence of the Sun has been unable to stop the planet cooling to its present temperature.

        Oh I forgot – sunset disproves something or other. Perhaps we can introduce the idea of the oceans as a hot water bottle. Stops your feet freezing at night.

        Maybe you meant a hotplate with a maximum temperature of 85C, turned off for 50% of the time. Cold coffee, indeed.

        Ditto hot water bottle.

        Misleading, inasmuch as the concept of a hot plate assumes an external heat source capable of maintaining an object sitting upon it at a constant temperature elevated above ambient, where radiation absorbed is equal to radiation emitted. The Earth exhibits a net loss of energy at all times. Real scientists refer to this as cooling, faux scientists and Warmists call this Warming.

        Here we should introduce the concept of non-equilibrium thermodynamics. The Sun provides a power input of 1361 W/m2 at somewhere above the surface at a satellite – in deference to your problem with the concept of TOA. This exceeds the power flux from the core of the Earth by several thousand times. The SW electromagnetic radiations warms the surface. But whether the planet warms or cools depends on the balance of radiative flux somewhere up in the sky where there is no atmosphere and all energy flux is electromagnetic. There are all sorts of factors involved – none of them a cooling Earth to more than a vanishingly insignificant extent. But hey – the core of the Earth is cooling. .

        Once again the desperate Warmist attempt to introduce irrelevant and misleading analogies in place of non existent experimental verification of an effect which does not exist.

        You might care to use your vast scientific knowledge, combined with your demonstrated ability to refer to research, to provide a link to experimental verification that it is, indeed, possible to prevent an object cooling by surrounding it with CO2. Or you might prefer to unleash another diatribe of unsubstantiated assertions – or handwaving if you prefer.

        Again – unless there is a realisation that the Sun warms the surface of the planet – warmist dogma like that – there is little sensible to be said. I can see this is a difficult idea for you and I would like to refer to the extensive research on this just to demonstrate my good faith.

        http://lasp.colorado.edu/data/sorce/total_solar_irradiance_plots/images/tim_level3_tsi_24hour_640x480.png

        Live well and prosper,

        Life’s too short for bad coffee, eccentric science and mad logic.

      • Matthew R Marler

        Mike Flynn: Talk of coffee pots and hot plates is purely a Warmist diversion. CO2 no more prevents the Earth cooling than it can prevent anything else cooling. I believe this is fact, and I welcome experimental verification to the contrary.

        Nobody writes about how CO2 can “prevent” cooling.

      • Matthew R Marler,

        You wrote –

        “Nobody writes about how CO2 can “prevent” cooling.”

        Ah, I see. So CO2 in the atmosphere doesn’t prevent the Earth from cooling. I presume that the Warmist redefinition of cooling is warming. Or does the surface increase in temperature whilst it is cooling?

        Does this mean that the absence of temperature increase for the last couple of decades is really warming because of the inability of CO2 to prevent cooling?

        If you can show that surrounding a body with CO2 can cause it to warm, please do so.

        If you can show that the Earth has increased its temperature due to the presence of additional CO2 in the atmosphere, please do so.

        Mindless unsupported assertions do not facts make.

        A few facts, agreeable or disagreeable, might further your cause.

        Live well and prosper,

        Mike Flynn.

      • Rob Ellison,

        You wrote –

        “There are all sorts of factors involved – none of them a cooling Earth to more than a vanishingly insignificant extent. But hey – the core of the Earth is cooling.”

        After four and a half billion years, a vanishingly insignificant rate of cooling of one millionth of a degree or so per year reduces the surface temperature of the Earth to a point where human survival is possible, even quite comfortable.

        As to the core cooling, I assume you use Wonderfully Warmist heat to magically teleport the cooling core’s lost heat to beyond the TOA, bypassing some thousands of kilometers of matter in the way. Otherwise, the energy lost would also result in the crust cooling as it obviously has in the past, barring some miraculous new discoveries in physics.

        This is no doubt the converse – anti heat, so to speak – of the Warmist heat which proceeds in likewise magical fashion into the depths of the ocean (but not elsewhere), bypassing just a handful of kilometers of water on the way. Maybe they meet along the way, and stop the ocean depths from freezing.

        The rest of your attempt to evade providing some experimental evidence supporting the Konclusions of the Karavan of Klimate Klowns, I leave to others to judge for themselves.

        Faith, whether good, bad, or just misguided, does not seem to have resulted in much warming over the last couple of decades. Neither does CO2, come to that.

        I leave you to your hot water bottles and coffee. Maybe you can heat both at night by exhaling CO2 on them. I doubt it, but good luck!

        Live well and prosper

        Mike Flynn.

      • Matthew R Marler

        Mike Flynn: . So CO2 in the atmosphere doesn’t prevent the Earth from cooling.

        It reduces the rate of radiation of energy from the earth surface to space. With ongoing solar energy input, the result is a slightly warmer surface and lower troposphere.

        Does this mean that the absence of temperature increase for the last couple of decades is really warming because of the inability of CO2 to prevent cooling?

        Short answer: no. The implication (“because of”) is insupportable.

        A complete and accurate explanation of why the the warming of the Earth surface has taken the shape (in graphs) of approximately the sine + straight line is not available.

        I think I shall let you have the last word if you would like it, and then leave you alone.

      • Matthew R Marler,

        You wrote –

        “It reduces the rate of radiation of energy from the earth surface to space. With ongoing solar energy input, the result is a slightly warmer surface and lower troposphere.”

        A good Warmist non sequitur. Insulation reducing the rate of heat loss – true – coupled with a misleading statement based on Warmist truthiness, plus leaving out critical information.

        The problem is twofold. Insulators work both ways, whether Warmists like it or not. The atmosphere reduces the amount of energy reaching the surface. This is why the Moon achieves both higher and lower temperatures when at the same distance from the sun as the Earth. The result, in the case of the Earth (or any body surrounded by a gas), is a slight diminution in temperature, when subjected to an external energy source, compared with a vacuum. University physics course bench experiments verify this.

        Another point is that, in concert with Rob Ellison, you overlook the fact that only about 50% of the Earth’s surface area is receiving energy from the Sun at any given time, whereas 100% is emitting energy. You may have noticed that generally, overnight, the surface cools to a lower temperature than the minimum during the period when exposed to the Sun.

        So back to my original question. Can you point to any experimental verification of this magical ability of CO2 to warm anything? A rhetorical question, I know. You can’t, and because you can’t, like Rob Ellison, in good dedicated Warmist fashion, you attempt to change the subject, redefine word meanings, avoid simple answers to simple questions, and generally obfuscate the issue.

        The Earth does not appear to be warming. Over the last four and a half billion years it doesn’t seem to have warmed either. It would be surprising if the heat generated by seven billion people and their associated activities could not be detected by suitable measuring instruments – for example thermometers, but in the World of the Warmist, I suppose anything is possible!

        Live well and prosper,

        Mike Flynn.

      • After four and a half billion years, a vanishingly insignificant rate of cooling of one millionth of a degree or so per year reduces the surface temperature of the Earth to a point where human survival is possible, even quite comfortable.

        The odds are vanishingly small of getting any sense out of Flynn of the Overdraft. The surface has in fact cooled quite quickly to a state where it is only the Sun – you know that big yellow thing in the sky – that keeps the world marginally comfortable. Some of the time at any rate.

        As to the core cooling, I assume you use Wonderfully Warmist heat to magically teleport the cooling core’s lost heat to beyond the TOA, bypassing some thousands of kilometers of matter in the way. Otherwise, the energy lost would also result in the crust cooling as it obviously has in the past, barring some miraculous new discoveries in physics.

        The rate of cooling of the core and mantle is thousands of times less than the energy coming in. Have I discovered some new source of nuclear fusion energy? I think I will call it Robbo energy. It comes from that big yellow thing in the sky called Robbo.

        This is no doubt the converse – anti heat, so to speak – of the Warmist heat which proceeds in likewise magical fashion into the depths of the ocean (but not elsewhere), bypassing just a handful of kilometers of water on the way. Maybe they meet along the way, stop the ocean depths from freezing.

        The rest of your attempt to evade providing some experimental evidence supporting the Konclusions of the Karavan of Klimate Klowns, I leave to others to judge for themselves

        Is this anything like the anti-matter? When the two meet there should a violent annihilation. The theory is that Flynn’s last remaining brain cells were in the way.

        Faith, whether good, bad, or just misguided, does not seem to have resulted in much warming over the last couple of decades. Neither does CO2, come to that.

        I leave you to your hot water bottles and coffee. Maybe you can heat both at night by exhaling CO2 on them. I doubt it, but good luck!

        The absorption spectra, statistical mechanics and the unholy ghost of CO2? We will leave the odd angry madness to Flynn of the Overdraft.

        But he did raise the coffee conundrum – the surface is heated by electromagnetic radiation – the hotplate analogy. Although he does seem to take denial to the extreme and deny the existence of the big yellow thing in the sky. And the oceans do store some of that heat – the stop the freezing feet analogy – which supplies warmth when the Robbo goes down.

        Live well and prosper

        Roos loose in the top paddock is the appropriate Australian expression.

      • Rob Ellison,

        I see you still cannot provide any experimental verification of the Wonderfully Wondrous Warmist CO2 Warms Stuff effect.

        As I thought.

        At least you appear to be even handed – no warming on the one hand, balanced by a severe lack of fact on the other.

        I wish you well – let me know when your coffee warms itself. Start small, and work your way up. Feel free to put it in the Sun for a few years – maybe it will get so hot it will boil. Good luck.

        Live well and prosper,

        Mike Flynn.

      •  Climate  Scientist

        Sorry Mike – but next time try reading my published explanation before making wild assumptions. The gravito-thermal effect is reduced by the temperature-levelling effect of intermolecular radiation. This affects the gradient in a planet’s troposphere, reducing it by about 5% on Uranus up to about 35% on Earth, but eliminating it altogether in liquid water. Furhermore, it is also dominated by any excessive new energy (such as in the stratosphere and at the ocean surface and thermocline) because diffusion is a slow process.

        And no, you have absolutely no evidence that the Earth or any planet in our Solar System is still cooling. The temperature gradient in Earth’s outer crust does not prove that there is net energy outflow. A given location on the equator of Venus cools by about 5 degrees during its 4-month-long night, and so Venus could have cooled right down if the Sun were not shining during its daytime and warming the troposphere and the surface back up again by the same 5 degrees, or whatever it is. Otherwise there would not be radiative balance.

        You have a lot to learn about thermodynamics Mike Flynn, a field in which I have specialised for years.

      • Climate Scientist,

        Ah well. Maybe the temperature gradient from the center of the Earth – say 6000K – to, as Rob Ellison would say – the TOA, say 4K, indicates a net influx of energy into the system to you. Now, if the Earth was isothermal right through, beyond the point at which the influence of the Sun becomes indiscernible, then one could say that a state of thermal equilibrium existed.

        But not otherwise, by definition.

        So, with respect, you’re wrong. I’m right. No CO2 induced warming. No magical natural warming of any kind, apart from the ephemeral surface heating due to the biosphere and its multitudinous activities, including Man’s preoccupation with oxidising carbon at the slightest provocation. Whether for the processes of life, transport, heating, electricity, or whatever, the final product is heat. If you can’t measure it, you’re obviously not trying!

        One of us is deluded, and I’m pretty sure it’s not me – but I would say that, wouldn’t I?

        In the meantime, don’t expect me to pay for your fantasy. I’ve barely got enough to pay for my own!

        Live well and prosper,

        Mike Flynn.

      • Mike: In your comment of September 24, 2014 at 11:31 pm, you say “the temperature of liquid nitrogen is nothing like the conditions in outer space. The temperature of liquid nitrogen is quite high by comparison.”

        Please work the numbers! While ambient radiation at room temperatures (290 – 300K) is about 400 W/m2, at liquid nitrogen’s boiling point of 77K, it is only 2 W/m2, not significantly different from zero.

        Then you say, “In fact, the major heat problem with man made satellites – at least the inhabited ones, and including EVA suits – is overheating.” Actually, no. In a cold ambient, with limiting energy supply, it is far smarter to insulate for the worst case, then selectively cool when not in the worst case. That is why EVA suits employ about 7 layers of radiative insulation, then have a cooling radiator in the backpack that can be used as needed when not in worst-case conditions.

        (People use the same idea when going outside on cold winter days. Wear enough insulation for the expected worst case, then bypass as needed. When I ski, I put on enough insulation to keep me warm on the ski lift at the top of the mountain in wind. Often by the time I ski to the bottom, I have opened up a couple of layers and I’m sweating.)

        Anyway, it is not an “irrelevancy”. The point is that the level of ambient radiation is often critical in computing energy balances and the resulting temperatures. When I first studied engineering heat transfer in the 1970s, the texts said to use for the clear night sky an “effective blackbody temperature of about -20C (253K). You get very different results for energy balances and resulting temperatures with this than using the 3K of deep space.

        You say, “All gases are radiatively active.” Again, you have no concept of the numbers. N2, O2, and Ar are many orders of magnitude less active in the far infrared than CO2 and H20 are — so much so that in comparison, they can be treated as having zero radiative activity in these bands without any noticeable error.

        Then my jaw dropped when you said, “If it were otherwise, the gas would have no temperature, as this is a measure of radiative activity.” No, temperature is a measure of the average kinetic energy of the molecules of a substance, radiatively active or not. This is just basic, basic stuff.

        Finally, you say, “You are still unable to heat anything by surrounding it with CO2. Sure, it will cool more slowly when insulated, but cool it will.” Here you simply demonstrate your inability to perform the simplest energy balance calculations, an in the opening weeks of an undergraduate thermodynamics course. You are confusing the case where there is no separate power source with one where there is (like the sun…)

      • Curt,

        I will respond point by point.

        “Mike: In your comment of September 24, 2014 at 11:31 pm, you say “the temperature of liquid nitrogen is nothing like the conditions in outer space. The temperature of liquid nitrogen is quite high by comparison.”

        Please work the numbers! While ambient radiation at room temperatures (290 – 300K) is about 400 W/m2, at liquid nitrogen’s boiling point of 77K, it is only 2 W/m2, not significantly different from zero.”

        Curt –

        Temperature of a vacuum – no degrees at all. It’s a vacuum. The nominal temperature of outer space is around 3K. Liquid nitrogen is hot by comparison. I’m right. You’re wrong.

        “Then you say, “In fact, the major heat problem with man made satellites – at least the inhabited ones, and including EVA suits – is overheating.” Actually, no. In a cold ambient, with limiting energy supply, it is far smarter to insulate for the worst case, then selectively cool when not in the worst case. That is why EVA suits employ about 7 layers of radiative insulation, then have a cooling radiator in the backpack that can be used as needed when not in worst-case conditions.

        (People use the same idea when going outside on cold winter days. Wear enough insulation for the expected worst case, then bypass as needed. When I ski, I put on enough insulation to keep me warm on the ski lift at the top of the mountain in wind. Often by the time I ski to the bottom, I have opened up a couple of layers and I’m sweating.)

        Anyway, it is not an “irrelevancy”. The point is that the level of ambient radiation is often critical in computing energy balances and the resulting temperatures. When I first studied engineering heat transfer in the 1970s, the texts said to use for the clear night sky an “effective blackbody temperature of about -20C (253K). You get very different results for energy balances and resulting temperatures with this than using the 3K of deep space.”

        Curt –

        You may care to check what NASA says. Here is just a tiny sample relating to EVA cut and pasted –

        “Why are EVA suits white?

        Astronauts use white spacesuits when they go on spacewalks to do work outside the space shuttle or International Space Station. White was chosen for a few reasons. One of the most important reasons is that white reflects heat so that the astronaut doesn’t get too warm. Astronauts can get too cold as well, but that is usually in their hands. Therefore, the spacesuits have heaters in their gloves.”

        Your irrelevant and misleading analogy about skiing is a typical Warmist ploy to mislead and confuse, and has little to do with NASA’s continued efforts to solve overheating problems cost effectively.

        “You say, “All gases are radiatively active.” Again, you have no concept of the numbers. N2, O2, and Ar are many orders of magnitude less active in the far infrared than CO2 and H20 are — so much so that in comparison, they can be treated as having zero radiative activity in these bands without any noticeable error.”

        Curt –

        Just a couple of examples. First, put your hand in front of a heat gun blowing hot air heated to 300C, and then tell me that the oxygen, nitrogen, carbon dioxide, and all the rest are actually at different temperatures.

        Alternatively, go to your nearest purveyor of gases, and detect the type of gas in a bottle by examining the bottle temperature, which will be the same as the contents. Further, let me know whether the bottle is full or empty, and what pressure is within it, by using the numbers.

        Rubbish. You can heat oxygen, hydrogen, nitrogen, Bombay Gin or anything else, to any temperature at all, short of plasma conversion or similar.

        “Then my jaw dropped when you said, “If it were otherwise, the gas would have no temperature, as this is a measure of radiative activity.” No, temperature is a measure of the average kinetic energy of the molecules of a substance, radiatively active or not. This is just basic, basic stuff.”

        Curt –

        I trust your jaw has returned to its accustomed position. Do you suffer from dropsy, much?

        If an atom is not radiating EMR, by definition it is at absolute zero. Maybe you are unaware of how light interacts with matter. As you may be a Warmist, I am using the word light as Einstein, Feynman, and others do, to encompass the entirety of the electromagnetic spectrum. Your knowledge of heat, temperature and so on, may not be as all encompassing as you would assume. I do not know. Maybe you were only taught basic, basic, stuff because your instructors thought you had potential to be a Warmist – who appear to have little grasp of reality in many instances. This may help to explain why the vast majority of Warmists are second and third raters.

        “Finally, you say, “You are still unable to heat anything by surrounding it with CO2. Sure, it will cool more slowly when insulated, but cool it will.” Here you simply demonstrate your inability to perform the simplest energy balance calculations, an in the opening weeks of an undergraduate thermodynamics course. You are confusing the case where there is no separate power source with one where there is (like the sun…)”

        Curt –

        You exhibit all the characteristics of the Warmist, I admit. You avoid the laws of thermodynamics, which is some respects is reasonable, given the difficulty of rigorous definition. But to proceed to depend on handwaving and specious nonsense about the simplicity of energy balance calculations, demonstrates the Warmist disconnect from reality better than anything I could say.

        In conclusion, on my side I have facts and replicable observations, supported by the theory and experimental work of Einstein, Feynman and others.

        On your side, you have unverifiable assertions, supported by quasi-religious Warmist handwaving and fervour. In other words, nothing much at all.

        I win, you lose. The world has cooled, and will continue to do so into the foreseeable future.

        Live well and prosper,

        Mike Flynn.

      • Mike:

        The more you write, the more I’m convinced you don’t even have the conceptual framework in your mind to deal with these issues in any coherent way. Let’s review:

        I initially pointed out that satellite makers do thermal testing of the satellites in a vacuum chamber whose walls are cooled by liquid nitrogen to simulate the heat-transfer conditions of space: no conductive/convective transfer, and virtually no ambient thermal radiation.

        You objected that liquid nitrogen temperatures could be higher than the effective blackbody temperature of deep space, which is about 3K. So I cranked the numbers, and showed you that the radiation, even for a blackbody, of surfaces at liquid nitrogen temperatures could not exceed 2 W/m2, trivial compared to the 400 W/m2 of real surfaces at earth ambient temperatures.

        Your response indicates that you have no comprehension of the significance of this, so I will break it down further. Let’s look at the blackbody flux densities of objects of the temperatures we have been discussing (you can multiply by a 0.95 emissivity if you want to get to real surface values, but it doesn’t matter:

        Deep space: 3K: Q = 5.67×10^-8 * (3^4) = 0.0000046 W/m^2

        Liquid N2 boiling temp: 77K: Q = 5.67×10^-8 * (77^4) = 1.99 W/m^2

        Room temp: 296K: Q = 5.67×10^-8 * (296^4) = 435 W/m^2

        The numerical values of the temperatures themselves do not matter here; it is the value of the radiative flux densities at these temperatures that matter for heat transfer. And the 2 W/m^2 at 77K is a heck of a lot closer to the 5 uW/m^2 at 3K than it is to the 435 W/m^2 at room temperatures.

        You still are missing the subtleties of space suit design. If the only concern were cooling, why are there 7 layers of reflective insulation around a heat-producing person? One who at rest produces 100 W through his metabolism, but radiates over 500 W from his body surface? Of course they want to reflect sunlight, but what about when the astronaut is not in the sun?

        Your arguments about different gases are just bizarre. I’m the one arguing that temperature is separate from the radiative intensity of different gases. A mercury thermometer is going to register the same reading for a highly radiative gas like CO2 as it is for a barely radiative gas like N2 when they have the same average kinetic energy in the molecules.

        You quote me as saying that the emissivity of gases like N2 and O2 is not exactly zero, just very close, then argue that I claimed they were exactly zero. The vast difference in emissivity/absorptivity in the far infrared of different gases is confirmed by a century of careful experimental observations in spectroscopy.

        But the biggest thing is that you cannot understand that the ambient with which an object is in heat transfer exchange with, whether through conductive/convective means, or radiative means, is critical to the temperature level of that object.

        Your grasp of thermodynamic concepts is so weak that you don’t realize that energy balance analysis is the most basic method for looking at conservation energy in any system, in other words, the 1st law of thermodynamics. If you had taken (and understood) even a single undergraduate thermodynamics course, you wouldn’t have made such a gaffe. And when you can’t come to grips with what really basic accounting, your allusions to Feynman’s quantum electrodynamics just expose you as the ultimate poseur.

      • @ Mike Flynn

        Not a direct response to your comment, just the place to reply to you directly to post this link:

        http://www.pnas.org/content/early/2014/09/05/1410229111.abstract

        I think you’ll like it.

      • Curt,

        It seems that you cannot bring yourself to quote what I said, and provide facts that support your rebuttal of my words.

        The Warmist tactic of arguing against what you think I said, rather than what I wrote, demonstrates a clear lack of basic comprehension combined with a lack of courtesy. So be it.

        You may think as you wish. You still cannot demonstrate the magical warming ability of CO2 in any scientific fashion. Your refusal to accept facts, does not change their existence. Nature doesn’t care what you or I think. I accept this – I cannot speak for you.

        You cannot demonstrate that the Earth is warming, in any case.

        Therefore, the theory that adding CO2 to the atmosphere causes the Earth to warm, would seem to be as yet unproven.

        Live well and prosper,

        Mike Flynn.

      • Bob Ludwicke,

        Thank you for the link. You are correct – I did like it. I believe that I am still on the side of the angels, so to speak, as more evidence emerges to support my thoughts on various things.

        In case you were concerned that I might become even more insufferable, rest easy. I am sure that many here would aver that this would be impossible. LOL!

        Live well and prosper,

        Mike Flynn.

      • Theory suggests that IR scattering should increase in a CO2 enriched atmosphere. It is based on experimental physics showing resonance of the molecule at specific frequencies. This is observed using specialized space borne observation systems.

        e.g. http://www.atmos.washington.edu/~dennis/321/Harries_Spectrum_2001.pdf

        Statistical mechanics insists that increased scattering results in an increased energy content – therefore heat – in the atmosphere. Warming has indeed been observed in the atmosphere in the 20th century – but there are many factors leading to temperature variability. A lack of warming does not show that the simple atmospheric physics is incorrect – merely that the system is complex. But we new that already.

        CO2 does not warm anything by itself – it changes the IR energy pathways of emissions from a planet surface heated by the Sun.

        It the basic idea that Flynn of the Monstrous Incomprehension fails to grasp. He then waffles on about it being a warmist conspiracy. Distinctly eccentric.

      • ‘Lord Kelvin’s name is associated with the laws of thermodynamics and the cooling Earth hypothesis. The widely accepted mantle plume conjecture has been justified by experiments and calculations that violate the laws of thermodynamics for an isolated cooling planet. Hotspots such as Hawaii, Samoa, Iceland, and Yellowstone are due to a thermal bump in the shallow mantle, a consequence of the cooling of the Earth. They are not due to ∼100- to 200-km-wide tubes extending upward from fixed points near the Earth’s core. Seismic imaging shows that features associated with hotspots are thousands of kilometers across, and inferred ascent rates are low. Plate tectonic-induced updrafts and a cooling planet explain hotspots and the volcanoes at oceanic ridges.’

        Don’t encourage him Bob. No one denies that radioactive decay happens in the mantle and the core cools. Just that it is immensely irrelevant to climate.

        ‘Internal vs. External Heat
        • The Earth receives ~ 1370 W / m2 from the Sun
        • About 0.05 W / m2 leaks from the center of the Earth’
        http://www.astro.sunysb.edu/aevans/AST205/notes/ast205-planetstructures2.pdf

        The radiant balance at TOA is far from constant – and is the driver of
        climate change.

      • Rob Ellison,

        You wrote –

        “CO2 does not warm anything by itself – it changes the IR energy pathways of emissions from a planet surface heated by the Sun.”

        I agree with you. Now if you care to attempt to do the calculations for the total energy prevented from even reaching the surface of the Earth, due to the atmosphere and all that it contains – particulate matter, varying concentration of gases such as CO2, clouds, and so on, you will discover quite rapidly that you cannot perform this calculation with any degree of scientific accuracy.

        Anyone claiming to be able to perform this calculation without making several unverifiable assumptions, for any particular point in time, or over any period, is either a fool or a fraud, to put it bluntly.

        If you wish to attempt this calculation, go ahead. Indicate the time or period involved, and actual appropriate measurements of physical parameters involved. Of course, you won’t. You would have to admit that there are no useful measurements of total energy intercepted by the Earth system, merely guesses, which have proved not to accord with reality.

        On to another point which you failed to mention. In the absence of the Sun – say at night – what happens to the temperature of the surface previously heated by the Sun?

        Feel free to keep abusing me if it makes you happy. New facts are more likely to cause me to change my opinion.

        The Earth cares not. It continues to cool. Remorselessly, relentlessly. Quite slowly, luckily for us.

        Live well and prosper,

        Mike Flynn.

      • Flynn the Dingbat accuses me of abusing him? He should try to include some actual substance – instead of merely ranting about warmist fraud and ignorance and repeating the utter irrelevance of the Earth cooling at 0.05W/m2. A fact – amongst many – that he seems almost uniquely oblivious to.

        Do the calcs yourself Flynn – http://climatemodels.uchicago.edu/modtran/

        But reality can only be appreciated with data – such as the Harries et al 2001 study that showed IR scattering in the atmosphere.

        Or this showing IR variability at TOA as a result of a number of factors.

        http://climatemodels.uchicago.edu/modtran/

      • Rob Ellison,

        You wrote –

        “Flynn the Dingbat accuses me of abusing him? He should try to include some actual substance – instead of merely ranting about warmist fraud and ignorance and repeating the utter irrelevance of the Earth cooling at 0.05W/m2. A fact – amongst many – that he seems almost uniquely oblivious to.”

        As you say, the Earth is cooling. According to you, at a rate of 0.05w/m2. If this works out to around one millionth of a degree C per annum, that’s about right.

        Even though you accept that the Earth is, indeed, cooling, you seem to complain if I say it. Maybe you would like to believe that cooling is really warming – although i would find this hard to believe. Maybe you can’t believe that the wonderful energy balance calculations showing warming are wrong.

        In any case, I agree with what you wrote – the Earth is cooling, slowly, but cooling nevertheless. The Earth’s energy content is slowly reducing – and as a consequence so is the average surface temperature, ceteris paribus.

        Live well and prosper,

        Mike Flynn.

      • Well no – the surface and atmosphere are warming 4800 times faster from the big yellow Robbo in the sky.

      • Oh -and in case anyone else is confused – I discovered a new nuclear fusion energy source and named it after myself.

        Life’s too short for bad coffee
        Rob Ellison

    • The energy diagrams are cartoons for cartoon climate scientists. They provide broad global estimates and have no regional implications at all. We are all aware that energy is transported both vertically and horizontally in the oceans and atmosphere.

      The system is governed by physical processes. The oceans and land are warmed by solar radiation – the oceans to 100 odd metres. The distribution of energy is governed by a balance between turbulent mixing to depth and warm water buoyancy. The latter dominates to produce the warm surface mixed layer. Slab diffusion is not a process that is all relevant.

      Back radiation reduces IR losses from the oceans and – if solar warming is unchanged – oceans warm until a new – conditional – equilibrium is reached. As the 2nd law suggests it should. S-B is irrelevant only useful in calculating a black body temperature – without an atmosphere.

      There is no direct gravitational effect on energy transport in the atmosphere. Pressure is gravity dependent – being an effect of the weight of the atmosphere. The top of the troposphere is cooler solely because energy is lost to space and there is less downward IR radiation. Warm air rises buoyantly, expands in the lower pressure and cools. Surface pressure differences from rising and falling air – interacting with the Coriolis force – creates surface wind fields.

      Climate is determined by the relevant physical processes – and unless you have more of a clue as to what these are than waffling about the 2nd law and cartoon energy diagrams it is all just hopelessly muddled.

      • Rob Ellison

        Although your great toe is in a cast, it appears that your mind is not so constrained. Though stated somewhat whimsically, your concise above depictions enter my mind and find rest and companionship. There is comfort in clarity.

      • RiHo08 +1 The Chief is always a good read even when he is not being polite ;)

      • Hi guys – I am so grumpy – I keep threatening to report my wife for abuse and neglect of a disabled person. Poor girl can’t possibly cope – I then start a fight and insist that she can’t beat me up because I’m disabled.

        I have decided to go to war with webnutcolonoscope – I can’t really believe there is any justification for the relentless vilification he indulges in. Not to mention the horrendous ineptitude. Who will rid us of this monster of misinformation?

      • Rob:
        “Climate is determined by the relevant physical processes – and unless you have more of a clue as to what these are than waffling about the 2nd law and cartoon energy diagrams it is all just hopelessly muddled.”
        Do you agree with Koonin that until observation capabilities are improved those physical processes will not be understood?

      •  Climate  Scientist

        And no, Rob, the thin surface layers of the oceans in non-polar regions are not warmed by direct solar radiation. Work it out with any on-line Stefan-Boltzmann calculator. At least 90% of solar radiation passes through the thin transparent surface layer, so you can’t assume it receives more than a mean of, say, 80W/m^2.in direct sun light on a clear day in the tropics, or more than about 20W/m^2 on average.

        And no, the Second Law makes it quite clear that no adiabatic diffusion or convection will transfer thermal energy up the steep temperature gradient from the much colder ocean regions, say 20m to 100m or more below the surface to the warmer surface. Any upward currents are not adiabatic and are acquiring energy from external sources, apart from being relatively rare anyway and not occurring on more than a very small percentage of the Earth’s ocean surfaces.

        No, the ocean thermocline never reaches a state of thermodynamic equilibrium because there is a new supply of thermal energy each day and that energy must be diffused downwards and then towards the poles, so there is continual energy movement and the temperature gradient is always there in the thermocline, so how could it possibly be thermodynamic equilibrium?.

        Gravity forms a density gradient in accord with the Second Law of Thermodynamics, and likewise it forms a temperature gradient as the process described in statements of that law indicate will happen, each being the same state of thermodynamic equilibrium. Pressure is merely a corollary, being proportional to the product of temperature and density.

        Now, when that thermodynamic equilibrium is disturbed by new incident solar energy absorbed in the troposphere, there is a propensity (as the Second Law tells us) for the state of thermodynamic equilibrium to be restored, meaning thermal energy transfers in all accessible directions (including downwards) away from the source of new energy.

        Yes the very top of the Uranus atmosphere is at a temperature close to the radiating temperature which is a little colder than 60K. But the base of the nominal Uranus troposphere (where there’s no direct solar radiation and no surface) is hotter than Earth at about 320K – very close to what I calculated it should be because of the reality of the gravito-thermal effect.

        So you also, Rob, display a lack of accurate understanding a thermodynamics, a field in which I have specialised for years..

      • Rob,
        Going to war is OK, but banning people for different views is not. Be thankful he is here and puts up arguments you can dissect.
        You do not want to live in an echo chamber.
        For every true believer he has, Michael and Fan? There are a thousand onlookers who will listen to the different views and hopefully use their brains.
        People with set views will not change whatever you do which may double his supporters. Is this a problem? No.
        His very presence here and arguments weaken his cause continuously and is therefore very welcome.
        See.

      • Angtech – webnutcolonoscope is a not merely a monster of misinformation but a constant source of calumny, abuse, aggression and malice.

        It is so pervasive and persistent and in complete disregard for blog rules and civilised norms of communication – that he needs to be put into permanent moderation and the nonsense filtered out. If that is too much work – banning is the other rational path.

        He comes here to abuse and malign and then repairs to the Borg collective echo chambers to prattle about the Krackpot and her Klimate Klowns. It is reprehensible and precludes to possibility of communication in good faith. So what is the point? Ban him – or stop him abusing the site.

  36. And I’ll add my congratulations to Judith & Nic.

  37. Both AR4 and AR5 suffer from the same defect: they both ignore the on/off nature of climate change, as do the models. They learned nothing from the 1940 singularity which showed clearly that climate temperature is not a stationary process and models that assume it is are inevitably wrong. Ptecewise simulation based on the best CO2 vibration data that HITRAN can provide is the way to go. It is wrong to treat the specific heat of CO2 as a constant and ignore the neutron content of the molecule. Nineteenth century thinking,

    The time constant of global atmospheric temperature change is about one month. but the aggregate time constant of temperature change of the oceans is decades. Is it about 30 or 40 years? Models that don’t have an accurate figure for this time constant are inevitably wrong, since they cannot calculate the time taken for heat to travel from atmosphere to the depths of the oceans.

  38. I’m having a hard time reconciling Judith’s recent comment at the national press club “We may be in for some surprises,” with trying to do the math on ECS. My interpretation of the “Surprise,” was that she thought it might get colder, because natural variability is not well understood, and her recent line of thinking is moving her towards the assessment it will get colder. I see some attempts regarding ENSO in the paper to find equivalent states. However, I thought the Judith’s basic position was we don’t understand the long term ocean processes well enough (hence we need paleo for the oceans).

    Anyway, it’s a bit confusing to me why someone who holds the view that the underlying systems that would allow a state to be determined, would then go on to determine equivalent states, and publish a paper on it. I suppose one way of thinking of it is that this approach is better than current approaches, and so advances the science based on what we know. Perhaps it will lead to research for areas we don’t know much about, and that’s the actual purpose.

    • She’s demonstrating that the IPCC is wrong according to their own assumptions.

      • Yeah, that’s one possibility, I acknowledge above that it’s better than current approaches. That is, given the current understanding, this is more accurate.

        I hope the purpose is to say we need to understand other things better. The way that works is that this is the best you can do, and to do better you have to dig deeper.

  39. Nic and Judy, well done. A triumph of science in an age of self-serving greed. This topic is the perfect segue for me to promote my new book in which I explain how the world works from my perceptive point of view behind a computer in an undisclosed bunker deep under the Saskatchewan crust. In my book, available at http://www.infowars.com, I explain complex non linear partial differential equations for my kindergarten clients.

    • Howard –

      You might be interested that I have three chapters discussing people writing books about views from bunkers in my new book.

      • Did I mention that I have a new book coming out?

      • Bothers me a little as well. Once or twice seems ok, but there’s a point…

      • Mind your manners Joshua. Remember, Judith said it is a technical thread.

      • Judy said that before, Bob. Lots of time.

        Howard’s new book may even contain some. Had you read it, you’d see what real-real-real data looks like. Not real-real-fake, real-fake or fake data, Bob. Only real-real-real one.

        The Internet consists of technical threads, billions upon billions of them.

        Trust me on this, Bob: I’m a ninja, but yesterday I was a Chef, two days ago a gardener, three days ago a Fortune 5,000,000,000,000,000 dog walker. I have done other things in my life, all listed in my next book.

        INTEGRITY ™ – Technical, Technical, I Want to Get Technical

      • Bob –

        You’ll be very interested to know that I have two chapters about manners in my new book that’s coming out.

        Did I mention that I have a new book coming out?

        It has chapters.

      • That isn’t writing at all, it’s typing.
        Truman Capote

    • Robert. You have it correct. I have, and will continue to do so, in fora other than your SkS. Firing fact falsifications to your ‘mainstream’ paper –that journals like Science and Nature have not retracted on much stronger grounds. (not yours. Marcott, for example.)
      Sorry, just is. You picked the popular but scientifically wrong side of the debate. That was your call. Now live with it.

  40. Matthew R Marler

    This sentence is on page 8: Gregory et al. (2013) provides graphically a time series of global mean sea level (GMSL) rise due to thermal expansion from 1860 based on a simulation by the CCSM4 AOGCM, with volcanic forcing included, starting in 850.

    Is the “850” a typo?

  41. How will any of this help, for example, increase the accuracy of weather forecasting? It will always come back to the fact that, nominally, it’s all about the Sun–e.g., Farmers Almanac is predicting another cold wet winter despite the increase over the years in the amount of atmospheric CO2: No region will see prolonged spells of above-normal temperatures; only near the West and East Coasts will temperatures average close to normal.

    http://farmersalmanac.com/weather/2014/08/24/2015-us-winter-forecast/

  42. You have a hint that you might be going down a better path when
    you have both WEBBY and Rob Ellison disagreeeing with you.

    just a hint
    better path.

    • ‘A new scientific truth does not triumph by convincing its opponents and making them see the light, but rather because its opponents eventually die, and a new generation grows up that is familiar with it.’ Max Planck

      Or as someone paraphrased it – science advances one funeral at a time.

      I quoted this above in reply to a Moshpit gibe about my ideas being stillborn and to get a clue It has earned the ire of the moderation bot for some reason.

      What I said was bah humbug – science progresses one death at a time – let the tumbrel roll.

      I have to admit that the tumbrel quip – hinting at the upcoming summit and guillotining climate scientists in the streets of Paris – was quite subtle – but to miss the most obvious allusion to scientific paradigms – and then to think that behaving like a spoilt 10 year old is a winning tactic suggests something about the naked Emperor Moshpit.

      What I suggested was reframing the question around an alternative climate paradigm. The US National Academy of Sciences (NAS) defined abrupt climate change as a new climate paradigm as long ago as 2002. A paradigm in the scientific sense is a theory that explains observations. A new science paradigm is one that better explains data – in this case climate data – than the old theory. The new theory says that climate change occurs as discrete jumps in the system. Climate is more like a kaleidoscope – shake it up and a new pattern emerges – than a control knob with a linear gain.

      The theory of abrupt climate change is the most modern – and powerful – in climate science and has profound implications for the evolution of climate this century and beyond. Climate is pushed past thresholds by changes in greenhouse gases or any of a number of control variables. The climate response is internally generated – with changes in cloud, ice, dust and biology – and proceeds at a pace determined by the system itself.

      The old theory of climate suggests that warming is inevitable. The new theory suggests that global warming is not guaranteed and that climate surprises are inevitable. It is an idea at the core of climate – and certainly not one that Judy is unfamiliar with. It seems to go over the head of the mad Emperor Moshpit and his jester webnutcolonoscope however – and may continue to do so. It is perhaps more than time for the tumbrel to roll for the Emperor – metaphorically at least.

      • Steven Mosher:

        You have a hint that you might be going down a better path when you have both WEBBY and Rob Ellison disagreeeing with you.

        There are skeptics who object to the entire IDEA of this equation. The best example is Willis. There are other types of objections, but at the bottom they all object to the notion of capturing , describing, characterizing, the complex system of the climate with a simple equation. They will never get much of a hearing. In the end the equation will either do a good job or not. Iin other words, I don’t think “systematic” skeptics have much of a role to play in the debate. They are outside the conversation. To be invited to this debate you have to accept, EVEN IF ONLY PROVISIONALLY, the notion that sensitivity is a meaningful metric.

        You only make a difference by working from the inside

        Rob Ellison. one death at a time?
        your ideas are still born. nobody cares what you think.
        get a clue.

        curryja:

        You’ll like the next paper we have coming out, stay tuned post ready early next week.

        I remain very concerned about abrupt climate change, but I am also working to demonstrate that if you accept the IPCC framing of the climate change problem, e.g. ‘forced’, that models are over sensitive and the sensitivity is lower than inferred from climate models. [my bold]

        You’re right and he’s wrong. Settle it that way. (Recognize the quote? The “empress” has spoken.)

        But tell me this Rob: will you be surprised when all the alarmists start jumping on your “chaos” bandwagon? I won’t. They need an excuse, and the linear paradigm is looking less and less like one.

        And as for Moshpit: blogs are now part of the system. Get a clue!

      • ‘But tell me this Rob: will you be surprised when all the alarmists start jumping on your “chaos” bandwagon? I won’t. They need an excuse, and the linear paradigm is looking less and less like one.’

        ‘Abrupt climate changes were especially common when the climate system was being forced to change most rapidly. Thus, greenhouse warming and other human alterations of the earth system may increase the possibility of large, abrupt, and unwelcome regional or global climatic events. The abrupt changes of the past are not fully explained yet, and climate models typically underestimate the size, speed, and extent of those changes. Hence, future abrupt changes cannot be predicted with confidence, and climate surprises are to be expected.

        The new paradigm of an abruptly changing climatic system has been well established by research over the last decade, but this new thinking is little known and scarcely appreciated in the wider community of natural and social scientists and policy-makers.’ http://www.nap.edu/openbook.php?record_id=10136&page=1

        Sure and it’s already well in hand AK – said with an Irish accent. I keep warning them that 40 years in the wilderness of non-warming is going to undermine the AGW meme something terrible – and they really need a plan B. But the mad. naked Emperor Moshpit insists that we need to be inside the tent pissing out rather than outside – well you get the idea.

      • Hansen has a “plan B”. He’s certain “that we are on the verge of crossing a tipping point into catastrophic climate change.” Sacrificing scientific integrity on the alter of “ideological necessity”.

      • Ak
        It doesn’t matter if rob is correct.
        He can’t calculate an answer to the question.
        Assuming he is wrong allows us to calculate an
        Answer
        When policy makers want an answer or justification
        For their decisions rob loses.

      • Matthew R Marler

        Rob Ellison: I quoted this above in reply to a Moshpit gibe about my ideas being stillborn and to get a clue It has earned the ire of the moderation bot for some reason.

        I think you missed his point about your idea being stillborn.

      • More like ‘which sex will the live infant be’?
        =======

      • ‘The researchers used a climate model, a so-called coupled ocean-atmosphere model, which they forced with the observed wind data of the last decades. For the abrupt changes during the 1970s and 1990s they calculated predictions which began a few months prior to the beginning of the observed climate shifts. The average of all predictions for both abrupt changes shows good agreement with the observed climate development in the Pacific. “The winds change the ocean currents which in turn affect the climate. In our study, we were able to identify and realistically reproduce the key processes for the two abrupt climate shifts,” says Prof. Latif. “We have taken a major step forward in terms of short-term climate forecasting, especially with regard to the development of global warming. However, we are still miles away from any reliable answers to the question whether the coming winter in Germany will be rather warm or cold”. Prof. Latif cautions against too much optimism regarding short-term regional climate predictions: “Since the reliability of those predictions is still at about 50%, you might as well flip a coin”.

        http://www.geomar.de/en/news/article/klimavorhersagen-ueber-mehrere-jahre-moeglich/

        Policy makers have a choice. Emperor Moshpit waving around the calculation that we know how to do – as opposed to the more difficult calculation that should be done. This is in fact a perennial problem in science more generally. But excuse me for saying that the Emperor has no clothes.

      • When policy makers want an answer or justification
        For their decisions rob loses.

        Answer: you can’t have an answer. Deal with it.

        They’ll just have to learn to make decisions in ignorance.

        Or cobble up some number that fits their agenda. Come to think of it…

      • Rob, abrupt changes frequently happen without greenhouse gasses. They may just as well prevent or delay abrupt changes.

    • The 40 years started around 1983.

    • Some people clear out the deadwood.

      Others plant new stuff.

      Others stand on the sidelines and cheer. And some try to plant weeds.

  43. Steven and I agree on one thing and that is climate sensitivity. He agrees it is unknown but measurable and I agree it is much lower than what the pundits including Judith have now defined.
    Climate sensitivity is in free fall baby, as RW would have said.
    While Lucia opines, rightly so elsewhere when I naively asked, that it must be positive given a push cannot feedback a greater force against it the pause in temperature mandates lower climate sensitivity.
    Take 10 years, put the CO2 up 30 PPM in that time and drop the temperature 1 degree.
    Not up to the maths, Judith, but that would put a spanner in the works wouldn’t it. And it is not even out of natural variability because naturally we have no idea what natural variability is, or it wouldn’t be natural.

  44. When you compute TCR relative to CO2 itself you get about 2 C per doubling (based on fitting a line to the last 60 years). I think the discrepancy comes from their forcing change being nearly 40% larger than the CO2 forcing itself, so when CO2 is doubled their forcing would proportionally change, not by 3.7 W/m2 but by 1.4×3.7=5 W/m2. It is therefore misleading for them to have a CO2-doubling forcing based on 3.7 W/m2 when they have this proportional factor in their calculations. Much confusion is avoided by using CO2 itself rather than translating to W/m2 and back with these factors creeping in in the process.

    • Rather than taking baseline periods which are sensitive to end-points, I would prefer to take a gradient fit, such as this, to a whole period. This gives TCR=2.3 C per doubling during the Keeling curve period.
      http://img42.imageshack.us/img42/1418/ecsgiss1959.jpg
      As Lovejoy and Vaughan Pratt showed, you also get 2 C per doubling using longer periods which become 3 C per doubling allowing for the ocean delay.

      • Jim D,

        Try a really long period to avoid accusations of cherry picking. Say four and a half billion years.

        What’s the sensitivity?

        Live well and prosper,

        Mike Flynn.

      • I don’t think I’ve ever heard the expression “gradient fit” before, but it looks like you’re just doing a basic OLS regression. If so, it seems silly to say:

        Rather than taking baseline periods which are sensitive to end-points, I would prefer to take a gradient fit, such as this, to a whole period.

        As one of the most common criticisms of OLS regressions is they’re overly sensitive to endpoints. It sounds like you’re rejecting one methodology because it suffers from a problem in favor of another methodology which suffers from the very same problem.

      • Matthew R Marler

        Jim D: , I would prefer to take a gradient fit,

        What is that? It sounds like a steepest descent algorithm to achieve the least squares fit.

      • jimd

        can you explain what a gradient fit is and how and why it is relevant in this circumstance?

        tonyb

      • A radiant fool seizing on a staircase?
        ==========

      • Gradient fit = OLS, See picture for what that is. Shorthand for determining a gradient by fitting a line. Sorry for the immense confusion it caused.

      • Matthew R Marler

        Jim D: Rather than taking baseline periods which are sensitive to end-points, I would prefer to take a gradient fit, such as this, to a whole period.

        Now that you have clarified gradient fit, perhaps you could clarify “take a whole period”.

        If you take two completely statistically independent but autocorrelated processes, you will nearly always find them to be correlated with each other over finite time spans. Thus, a finding that two selected autocorrelated time series are correlated with each other is not evidence that they are not independent, it is evidence that you have selected a finite time interval. This is explained in “Analysis of Neural Data” by Kass, Eden and Brown. All the attempts to divine the relative influences of natural processes, land use changes, and CO2 changes are plagued by this and other problems.

        you also get 2 C per doubling using longer periods which become 3 C per doubling allowing for the ocean delay.

        Why do you get 3 C per doubling when you allow for the ocean delay instead of say 2.4 C per doubling? The surface equilibrates, approximately, to changes very rapidly (as shown by day/night differences), but the deep ocean much more slowly.

      • Matthew Marler, this is a period that covers 70% of the anthropogenic addition to the atmosphere, so it is very representative of the total effect. Regarding delay, you can take 10 or 20 years and the sensitivity depends how long you take. Lovejoy showed that the correlation has a broad peak over the varying delays of 10- 20 years, so it is not clear which delay to apply, but a delay correlates better than the unlagged value.

      • Matthew R Marler

        Jim D: Regarding delay, you can take 10 or 20 years and the sensitivity depends how long you take.

        My question was, if TCR = 2.3C per doubling, how do you get 3C per doubling when allowing for ocean delay instead of a smaller number such as 2.4. You are not telling us, I hope, that 10 – 20 years after the transient response the climate is near to the equilibrium response.

      • Matthew R Marler

        Jim D: this is a period that covers 70% of the anthropogenic addition to the atmosphere, so it is very representative of the total effect.

        How is that a “whole period”, instead of a limited selection, more limited that the selection used by Lewis and Curry?

      • He picked a number from the bigger hat. Why wouldn’t it be a bigger number. Did you see that? Wanderful.
        ===========

      • Matthew Marler, yes, CO2 and temperature are changing so fast and consistently that it really is that sensitive to the delay you choose. I don’t know how to interpret that. Longer delays may be more realistic because the ocean has to respond with a delay. As Vaughan Pratt showed, it is a characteristic of an exponential rise that there is this ambiguity between delay and sensitivity.

      • As for the period, the paper chose a local max in 1940 just before a decline in temperature that wasn’t representative of the rise after 1959 and they figure that decline in to their temperature change. I don’t think it is good to have a baseline that starts at a local max, unless you are trying to diminish the temperature change. 1959 may be a better starting time, being in a fairly flat period on the downward decline after the max.

    • So it is good new/bad news. The sensitivity to CO2 is 40% less, but the forcing is changing 40% faster than CO2’s forcing alone. This makes it a wash, and their warming rate for different emission scenarios ends up being about the same as the IPCC’s. For example, by the time CO2 doubles, the forcing change is 5 W/m2 not 3.7 W/m2, so their warming applies to this raised amount. Or, the forcing will reach 3.7 W/m2 by about 2050 at current emission rates as CO2 only needs to reach 470 ppm.
      The way they get the low sensitivity is to assume that the forcing is changing much faster than CO2, implying that the other GHGs have a much stronger effect than aerosols. In AR4 these mostly offset each other, but AR5 does have central estimates with wide uncertainties that the forcing really is changing faster than that from CO2 alone while the AR4 offsetting is still comfortably within the uncertainty too.
      A way to cancel out this aspect of the uncertainty is to use the CO2 as a proxy for the forcing (Lovejoy, for example). This allows warming to be related simply to CO2, and that sensitivity (TCR=2 C per doubling) can be directly estimated from observations. The linearity of the fit is encouraging for the proxy assumption. It also means emissions of other GHGs have to be addressed to the extent they really do add 40% to the CO2 forcing, but the uncertainty is CO2 forcing + 35% +/- 65% from aerosols+GHGs in AR5.

      • What makes you think you know the forcing?

      • Two things are known with a high degree of accuracy: the CO2 forcing rate of change and the temperature rise. Where disagreements begin is how to fit these numbers to total forcing and transient climate sensitivities. With these constraints you can have a range from high forcing rates of change and low sensitivity to low forcing rates of change and high sensitivity. For example, a high forcing rate of change of 0.5 W/m2 per decade, as is consistent with Lewis and Curry, goes with a low sensitivity, like 0.3 C per W/m2, while a lower forcing rate of change like 0.3 W/m2 goes with a high sensitivity like 0.5 C per W/m2. These both give a product of 0.15 C per decade to agree with observations, but with different forcings due to uncertainty. Using temperature change per CO2 forcing increase avoids most of these uncertainties. It just assumes that the total forcing is proportional to CO2 forcing even without knowing if it is more or less than the CO2 forcing. This is where you get TCR = 2 C per doubling from.

      • We don’t know the forcing because we don’t know what the albedo changes were. Even where there is data – it is dismissed.

        The temperature change since 1944 – the period of most CO2 increase – is some 0.4 degrees C. !944 is the cusp of the change to cooler temps – and 1998 likewise. The cusps of multi-decadal natural regimes. A convenient reality.

        Assuming it is all anthropogenic – a big call – TCR is some 0.8 degrees C.

        If you are going to play with numbers – play fair.

      • The main albedo change in the last 60 years is probably ice/snow loss, which is another positive feedback to the change and not independent.

      • It is interesting that the fastest warming area at 1 C per decade is the Arctic Ocean. I say this is feedback. Not sure if there is another explanation being proposed here.

      • Mostly decadal variability just like the west coast US, Alaska, etc.

      • I think Rob is right, arctic melt is mostly natural. Recently there was a post on WUWT on how arctic ice flux removes CO2 from the atmosphere. I think this might account for maybe 10-20% of CO2 rise this century. This may have big implication for climate sensitivity.

        It is very likely that Ice core data misses a lot of variability and that CO2 sign degrades over time. I think CO2 concentrations are likely higher and more variable than analysis shows.

      • Sorry, 10-20% is probably a low ball. Pre 1950, there was a ~12% increase in CO2 before emissions were really significant.

      • The 1 C Arctic temperature rise hasn’t received much attention because it mostly happened during the pause.

      • Matthew R Marler

        Jim D: It just assumes that the total forcing is proportional to CO2 forcing even without knowing if it is more or less than the CO2 forcing. This is where you get TCR = 2 C per doubling from.

        That makes 2 C per doubling an over-estimate of the CO2 effect itself, because it confounds all the forcings correlated with CO2 increase, whatever they may be. The three obvious classes of unknown forcings are: (1) anthropogenic forcings not dependent on CO2; (2) non-anthropogenic forcings; (3) feedbacks from warming.

        Forecasting the climate response from the next doubling depends on assumptions about processes in those three classes.

        For examples in (1): land use changes like deforestation and urbanization.

        For examples in (2), whatever is responsible for the apparent 950 year oscillation in global mean temp; and whatever is responsible for the oscillations on the other time scales, like ENSO.

        For examples in (3): increases in low-level water vapor and fog; increased cloud formation and rainfall.

        Those short lists are not exhaustive.

        Anyone want to make a case that all of those are either (a) known (i.e. estimated) or (b) negligible?

      • Matthew Marler, based on the last 30-60 years’ record of temperature and CO2, the climate is consistent with one that is sensitive to CO2 at 2 C per doubling, and that is just transient, which is below where it ends up after the forcing stops changing. For planning purposes, I think this length of record is robust enough, and the easy-to-calculate guideline from this rate would be about 1 C for every 100 ppm above 280 ppm.

      • Matthew R Marler

        Jim D: For planning purposes, I think this length of record is robust enough, and the easy-to-calculate guideline from this rate would be about 1 C for every 100 ppm above 280 ppm.

        For what it is worth, you are avoiding my questions: why is your choice of interval better than Lewis and Curry’s choice, and how does it amount to a “full period”? Why is the long-term increase 3C per doubling instead of a mere 0.1 more than the transient response? How long does it take for the “long term” response at the surface and lower troposphere to be near to its final value after the transient response is near its final value (for “near”, pick a measure, such as “within 0.1 C”)?

        Depending on what other processes were going on, the record is consistent with CO2 forcing effects everywhere between 0 and 2C, and the 2C figure assumes that nothing else important was happening. Your easy to calculate guideline is a great deal faster than the 2C per doubling: the 2C per doubling gives an increase of 2C as the CO2 increases from 400 to 800, but the easy-to-calculate figure is twice that.

        All together, what is the evidence that the climate at 280 was better than the climate at 400? droughts, floods, hurricanes, tornadoes, global ice cover, and rainfall are about the same (maybe a slight increase in total rainfall); forests and all other vegetation that has been studied are growing faster; actual effects of putative ocean pH change are negligible to non-existent.

      • Matthew Marler, the choice is the full period of CO2 measurements from Mauna Loa, before which we only have estimates. You seem to also be doubting that the transient response is much less than the equilibrium response, but I have yet to see anyone including Lewis and Curry claim that the difference is small, and it can be 50% larger just due to the delayed ocean response and the water vapor that adds. Remember when the CO2 rise stops, there is a forcing imbalance until the ocean heat content has risen to cancel it. This imbalance is large and growing. Later as the ocean warms to remove the leftover imbalance, more water vapor is added (which Lewis and Curry don’t include in their calculation of ECS thus lowballing it). Also you are asking if 400 ppm is better than 280 ppm when you should be asking if 700 ppm and rising is better than 450 ppm and stable. These are the real choices going forward.

  45. A simple biologist

    Perhaps someone could simplfy this for a simple biologist.

    The temperature sensitivity for doubling CO2 is roughly what one would expect from CO2 acting independently, ie. no forcing.

    Berkeley Earth’s Skeptics guide to climate change page 6 shows a CO2 graph overlaid onto the land suface temp. graph. Look to me like a pretty good match. Certainly the temperature does not appear to increase faster than CO2 and is likely to be less for total Global Surface temperature. ie.e not much evidence for forcing.

    Am I missing something?

    • A simple biologist

      Can you provide a link?

      tonyb

    • I think you meant no feedback rather than no forcing. This was mainly an exercise in getting more sensible estimates published in a major journal using the IPCC’s own numbers as a bulwark against the more pessimistic and speculative numbers which are usually published.

    • asb, don’t knock simple understandings even if technically flawed. You are on the trail.
      =========

    • OK, I’ll explain better. Your simple understanding is that feedbacks are wrong. You are right.
      =============

    • Pssst! The clouds are the magic potion.
      ====

    • Forcing – CO2, more solar. more black soot on snow, more aerosols blocking solar.
      Feedback – Water vapor, melting sea ice, less seasonal snow duration in Northern Canada.
      Correct me if I am wrong please.
      Feedbacks don’t runaway to a collapse in Climate Science as far as I know, like when that guy back in elementary school put a gum foil wrapper into an electrical outlet and shorted it out. Call them soft landing feedbacks that bring you to a higher temperature. As to why melting sea ice is a positive feedback that doesn’t case a runaway and collapse (melt like crazy) it might be that it’s not in total a positive one. The insulating value may exceed the albedo value making it a negative feedback and also explaining part of why the climate hasn’t tipped over into an unrecoverable state to date.

      As a biologist, if you had the time, you might have some insights for us. We seem to be missing some CO2, and like to discuss the sources in their entirety.

  46. What impresses me most about this paper is the prominence given to uncertainty. The paper usefully discusses the range of estimates of increase in OHC (Ocean Heat Content).

    I had previously used Stevens et al (2012). to assess Roy Spencer’s model of OCH (Ocean Heat content) and found 0.6 Wm-2 consistent with TCR of 1.3 degC. Dr Spencer;s estimate implied about 1.6 degC for ECR.

    (References at the end of my text.)

    It is also interesting to see that the paper mentions that Loeb’s 0.5 W m-2 would be equivalent to 1.7 ECR from which I infer a TCR of about 1.4, not far off what I believe is consistent from Roy Spencer and Graeme Stephens.

    Where I have some difficulty is reconciling the narrow error bars with Stephens et al. (2012) who state, “The current uncertainty in this net surface energy balance is large, and amounts to approximately 17 Wm–2. … The uncertainty is also approximately an order of magnitude larger than the current estimates of the net surface energy imbalance of 0.6 ±0.4 Wm–2 inferred from the rise in OHC.”

    This implies that the OHC may have risen, fallen or maintained homeostasis. The data is either not precise enough to tell or not comprehensive. It would also mean that neither ECR nor TCR can be reliably estimated from OHC because the satellite data is more precise and reliable than data for OHC.

    It may be that Stephens et al. (2012) and Kopp & Lean (2011) when read together indicate there is some other variable that is missing from the Earth’s energy budget. Such a variable would be easy to miss because the net imbalance at the ocean’s surface is only 0.17% of the downward or upward energy fluxes (about 0.6 W m-2 divided by about 340 W m-2).

    A bookkeeper, when she sees a 98 cent error, does not know without checking if there is a wrong entry in cash or if there is an error in posting some item as large as $100,000.98 or errors in several postings.

    What NASA and JPL scientists like Loeb and Stephens are telling us is that the imbalance in the energy budget arises from subtraction of two relatively big fluxes, The difference in the net imbalance is so small compared to the error in measuring the fluxes, that we cannot know for sure either the size or the sign of the net imbalance.

    My problem is that I cannot see how the date measuring OHC can be more precise and accurate than the satellite data.

    References:

    Roy Spencer’s OHC & TCR model
    URL: http://www.drroyspencer.com/2011/06/

    Graeme L. Stephens et al, An update on Earth’s energy balance in light of the latest global observations. Nature Geoscience Vol. 5 October 2012

    URL:
    http://www.aos.wisc.edu/~tristan/publications/2012_EBupdate_stephens_ngeo1580.pdf

    Greg Kopp and Judith L. Lean, A new, lower value of total solar irradiance: Evidence and climate significance, 2011

    More references here: http://geoscienceenvironment.wordpress.com/2014/09/04/the-emperors-of-climate-alarmism-wear-no-clothes/

    • The satellites are good for measuring changes in radiation but do not currently have a high accuracy as to absolute values. The ARGO era oceat heat content measurements are able to give much more accurate estimates of the Earth’s radiative imbalance over periods of 10+, even 5+, years than the satellites. Even extending to pre-Argo periods, with a long period the errors in ocean heat content values have to be very large to have a major effect on the mean rate of heat uptake over the period.

    • Matthew R Marler

      Frederick Colbourne: What impresses me most about this paper is the prominence given to uncertainty. The paper usefully discusses the range of estimates of increase in OHC (Ocean Heat Content).

      My problem is that I cannot see how the date measuring OHC can be more precise and accurate than the satellite data.

      I think that is a good comment.

  47. daveandrews723

    As a non-scientist it is fascinating reading all of the comments. My conclusion is that never in the history of science has so much guesswork and so many unsupported hypotheses been the foundation of a claim like the one being made by warmists that CO2 is a major driver of global temperatures.
    I can not understand how the legitimate scientific community EVER allowed that assertion to take hold in the public debate. The scientific community should be embarrassed by their colleagues who are twisting facts and reality to advance a social agenda. This is not science. It is religion.
    I applaud all of the skeptics in the scientific community who are now standing up to the alarmists. I
    I always find it amusing that 40 years ago the prevailing wisdom in the scientific community was that the earth was cooling. Then that prevailing wisdom turned on a dime and global warming was upon us.
    My understanding is that climatology is a fledgling academic discipline compared to most others. My impression is that many climatologists are not worthy of being called scientists. They don’t have their flight wings yet, so anything they say about the causes of global temperatures and the future of global temperatures should not be considered valid. Their arrogance is truly amazing.

    •  Climate  Scientist

      Well said daveandrews. The biggest single problem is that climatologists don’t understand physics, but don’t deign to consult physicists and ask them to peer-review their conjectures. What happens in a planet’s troposphere is a matter of thermodynamics far more than radiative heat transfer, but they don’t understand either branches of physics. They invent their own “fissics” and teach it from generation to generation of climatologists, and even to young school children.

      Two and a half years ago this profound comment closed the thread regarding a totally incorrect refutation on WUWT by Robert G. Brown. The comment reads …

      “I have been earning a living as an engineer specializing in cutting edge technology for very large scale thermal energy transfer processes and power systems for close to 40 years. My credentials include BS, JD and PE, and I have four patents.

      “As for my qualifications to engage in argument with PhD’s, I have many times been part of and have led teams with PhD team mates. I was also married to a PhD for 20 years.

      “Because the import of the consequence of the radial temperature gradient created by pressurizing a spherical body of gas by gravity, from the inside only, is that it obviates the need for concern over GHG’s. And, because this is based on long established fundamental principles that were apparently forgotten or never learned by many PhD’s, it is not something that can be left as an acceptable disagreement.”

      • Matthew R Marler

        Climate scientist: What happens in a planet’s troposphere is a matter of thermodynamics far more than radiative heat transfer, but they don’t understand either branches of physics.

        “What happens” is a function of pressure and temperature differentials, and all processes of energy transfer, not thermodynamic equilibrium. So your argument is tangential to the question of whether adding CO2 will change “what happens.” Quantitative accuracy in explaining “what happens” requires quantitative accuracy in the estimates of all energy transfer rates, not equilibrium. The classic example of the contrast between rate considerations and equilibrium considerations is the breakdown of ammonium nitrate: the rate of breakdown is occasionally high, but almost always 0, whereas the reaction always has a lower energy end point than starting point.

        Nothing in the climate debate is that dramatic. However, if extra CO2 reduces the cooling rate of the Earth surface, and the rate of radiant energy transfer from Sun to Earth surface is little changed, then the Earth surface will warm (other things being equal) from what it was before the increase in CO2.

        A lot is known about why equilibrium calculations do not predict rates, the point is that equilibrium calculations do not predict rates.

    • AFAIK most scientific disciplines have similar feet of clay.

      If you want to eat sausage, don’t visit the sausage factory…

  48.  Climate  Scientist

    There is compelling empirical evidence in temperature records (analysed here) that water vapour cools and cannot warm the Earth’s surface. Likewise all the existing carbon dioxide cools by about 0.1 degree according to valid physics and deductions from the amount of cooling by water vapour, which is about 10 to 12 degrees.

  49. Let me put it as the first order differential global energy equation.

    d(W&H)/dt = energy in (J/s) – energy out (J/s)

    Where W&H is work and heat – and is largely ocean heat content.

    So what does the data tell us.

    This is ARGO ocean heat – it shows in the period modest ocean warming, steric sea level rise and negligible changes in salinity although tending to a reduced ocean volume – i.e. more water evaporating from the oceans than entering from all sources. .

    http://watertechbyrie.files.wordpress.com/2014/06/vonschuckmannampltroan2011-fig5pg_zpsee63b772.jpg

    Incoming energy is measured by SORCE. It shows an absolute value in Earth orbit – and as one of your references describes the total has been reduced by 5W/m2 in recent times. The problem is in calibration – there is little certainty within +/- 5W/m2. Measurement of changes however is much more precise at about 1W/m2 from peak to trough – some 0.25W/m2 cooling at the surface over the period of ARGO ocean warming.

    http://lasp.colorado.edu/data/sorce/total_solar_irradiance_plots/images/tim_level3_tsi_24hour_640x480.png

    So already we can tell 2 things. The radiative imbalance in the period –
    d(W&H)/dt – is positive because the oceans were warming – and it is not the Sun.

    Energy out they don’t even try to evaluate in absolute terms. The data is presented as anomalies – power flux anomalies as W/m2 – and 1 Watt (W) for 1 second (s) is one Joule (J). Again – anomalies – changes in other words – are very precise.

    This one shows infrared emitted, shortwave reflected and net (upward warming by convention) with trend lines and colors showing different CERES instruments. It shows increases and decreases in energy out in IR and SW over a period.

    http://watertechbyrie.files.wordpress.com/2014/06/ceres-bams-2008-with-trend-lines1.gif

    What this shows is that ARGO ocean warming last decade was entirely due to cloud cover changes. A profound result which confounds simple ideas of a constant radiative imbalance.

    The homework exercise – as webnutcolonoscope is wont to say – illustrates the importance of balancing the budget with ocean heat and radiant flux. With a single data source – you are clueless. With three and the 2nd law of thermodynamics on your side – you can infer causality.

    Oceans warm and cool – the radiative imbalances changes from positive to negative. Clouds change – associated with changes in ocean and atmospheric circulation – in the short term and radically change the energy budget. It is a complication that needs TOA radiant flux data to evaluate and ways to do so within the calibration constraints need to be found. Ultimately it can only be done by closing the global energy budget using ocean heat content data.

  50.  Climate  Scientist

    Judith Curry and others, please note:

    These are the facts (based on correct physics and empirical evidence) which smash the greenhouse radiative forcing conjecture …

    (1) As also stated in the above quoted comment, gravity forms a temperature gradient (and a density gradient) in the tropospheres of all planets with significant atmospheres, including gas giants. This is a direct corollary of the process described in statements of the Second Law of Thermodynamics.

    (2) Back radiation can only slow radiative cooling back to the atmosphere. The thin surface layer of the oceans in non-polar regions also cools by non-radiative processes both into the atmosphere and, as usually overlooked, also by downward diffusion and convection which are both towards the colder regions found at the base of the ocean thermocline. That energy only gets back to the surface in polar regions, and so it does not affect the temperature of the ocean surfaces in non-polar regions – probably about half of Earth’s surface.

    (3) Solar radiation cannot possible raise the temperature of that thin surface layer of the ocean to the observed temperatures, because over 90% of the radiative flux is warming layers below that, and you can’t double count it. You must only enter into Stefan-Boltzmann calculations less than 10% of the solar flux reaching the surface, which is about 10% of 161W/m^2 on average. In fact, that mean flux of 161W/m^2 would only support a temperature of about 235K even if the Earth were paved in black asphalt for which emissivity is 0.93. Check it with an on-line Stefan Boltzmann calculator. Back radiation cannot be added to solar flux when determining the surface temperature and, in fact, it does not penetrate warmer water by more than a few nanometres. Its electro-magnetic energy is pseudo scattered and is never converted to thermal energy in the warmer water.

    (4) Empirical evidence proves the existence of the gravito-thermal effect, and it would warm the Earth’s surface to a mean of about 295K to 300K but for the fact that water vapour reduces the magnitude of the gradient (aka dry/wet adiabatic lapse rate) and leads to supported temperatures about 10 to 12 degrees cooler. These temperatures in the base of the troposphere slow down and even stop the surface cooling in the early pre-dawn hours, regardless of radiation losses which are balanced by “heat creep” diffusion and conduction back into the surface. These non-radiative transfers of thermal energy occur as a result of the Second Law of Thermodynamics as they are restoring thermodynamic equilibrium. They are most prevalent into the ocean surfaces during sunlit hours and especially on cloudy days.

    • … gravity forms a temperature gradient..

      There is a temperature gradient caused by atmospheric radiations – warm air rises, expands and cools in lower pressure at height – but this is just the lapse rate and doesn’t create cooler temps at height.

      Back radiation can only slow radiative cooling…

      Reduced losses with constant inputs results in warming of the top 100m.

      Solar radiation cannot possible raise the temperature of that thin surface layer of the ocean to the observed temperatures, because over 90% of the radiative flux is warming layers below that…

      The mixed layer is variable – up to a couple of hundred metres depth – but is of course mixed. Warm water rises and turbulence mixes water to depth. Is he talking about the skin temperature? This forms because heat is radiated from the top few microns net upwards – this layer is cooler than the underlying water because the radiation losses are quicker than mixing processes. The skin is continually mixed into the underlying water column in the dynamic ocean environment.

      Empirical evidence proves the existence of the gravito-thermal effect…

      It doesn’t. Each of the processes in atmospheric physics has a physical mechanism. Convection – absorption and emission – phase transition – turbulence – etc. If there is no physical mechanism that can be simply described – we are waffling at some other meta level entirely. Often with little connection to reality.

    • Oh Gee a Climate Scientist lowered themselves and posted a comment on the Internnet.

      What a blessing to civilization.

      Andrew

      • Isa 13:10 For the stars of heaven and the constellations thereof shall not give their light: the sun shall be darkened in his going forth, and the moon shall not cause her light to shine.

      • A joyful 5775, to all.

    •  Climate  Scientist


      Rob Ellison, Mike Flynn and silent readers.

      What makes you think warm air always rises? Try suspending one of those oil filled convection heaters near your ceiling and tell me whether or not some warm air falls. The direction of convection (which includes diffusion and advection) when there has been previously a state of thermodynamic equilibrium (with its associated temperature gradient formed by gravity) is always in all accessible directions away from any source of new thermal energy which has disturbed the previous state of thermodynamic equilibrium. For proof read “Why It’s Not Carbon Dioxide After All.”

      Some readers here don’t seem to know the difference between isothermal conditions, thermal equilibrium and thermodynamic equilibrium. Even Wikipedia could help you on that, but it’s not surprising you don’t understand thermodynamics – as I well know from helping students with physics and mathematics for about 50 years.

      Well, you still have numerous other points to respond to that I’ve made in comments above and throughout Facebook and some other climate blogs. No one has replied with any valid counter arguments that I can’t refute. No one can explain the temperatures in the Venus and Uranus tropospheres in any other way than using calculations based on the gravito-thermal effect. No one in the world has correctly disproved the gravito-thermal effect in well over 100 years since the brilliant 19th century physicist Josef Loschmidt explained it..

      Water vapour cools by about 10 to 12 degrees. Carbon dioxide cools for the same reason by about 0.1 degree.  I have produced empirical evidence regarding water vapour cooling, and that supports the gravito-thermal explanation of planetary tropospheric and surface temperatures. Where is any contrary study?

      • Matthew R Marler

        Climate Scientist: Water vapour cools by about 10 to 12 degrees. Carbon dioxide cools for the same reason by about 0.1 degree. I have produced empirical evidence regarding water vapour cooling, and that supports the gravito-thermal explanation of planetary tropospheric and surface temperatures. Where is any contrary study?

        Can you tell what will happen in the climate (global mean temp or rainfall perhaps) when the concentration of CO2 doubles? Or increases to 600ppm?

      • Warm air rises because it is less dense – it is all to do with kinetic energy. Turbulent mixing is another physical process entirely.

        Doug – it is time to go away again. People have just stopped listening. It is the same eccentric unscience over and over. Wild claims justified by meta waffle invented to reach a pre-determined conclusion.

        The emission and absorption explanation for tropospheric temperatures. We don’t need another explanation – especially one where the statistical mechanics of air parcels are governed by gravity and are therefore invariant.

      • “helping students with physics and mathematics for about 50 years”
        http://www.facepalm.com/img1/math-facepalm-2719_w.jpg

  51. Lauri Heimonen

    Judith Curry:

    ”One of the most important contributions of this paper is the assessment of uncertainties in external forcing on estimates of climate sensitivity, which is something that has hitherto been only partially allowed for in most climate sensitivity estimates. As pointed out by the AR5 and this paper, the uncertainties in external forcing are substantial, particularly for aerosols.”

    In my opinion, the most ‘substantial uncertainty’ is related to the share of anthropogenic CO2 in atmosphere. IPCC scientists assume all the increase of CO2 in atmosphere, during the industrialized time, to be caused by anthropogenic CO2 emissions. As I have earlier stated, e.g. in my comment http://judithcurry.com/2011/08/04/carbon-cycle-uestions/#comment-198992 , only about 4%, at most, of the recent total CO2 content in atmosphere and of any recent increase of CO2 content in atmosphere have been caused by anthropogenic CO2 emissions. As, in addition, recent increase of CO2 content in atmosphere seems to have followed warming and not vice versa, it is understandable, that the climate sensitivity adopted by IPCC can not be distinguished from zero.

    My statement above agrees e.g. with what Tom V Segalstad expresses; http://www.co2web.info/ESEF3VO2.htm : ”Carbon isotopic trends agree qualitatively with fossil fuel CO2 emissions like stated by IPCC, but show quantitatively a fossil fuel CO2 component of maximum 4 % versus the 21% claimed by IPCC.”

  52. Another nut. One who can’t even use copy/paste. Like this.

  53. I have now had a chance to read the paper. First of all I’d like to congratulate Nic and Judith on writing a document that I found relatively easy to follow, even if some of the technical detail on the method is beyond my pay grade.

    You offer a strong justification for your preferred base and final periods, which combined with your calculation of the effect of ignoring the ‘pause’ will help against accusations of cherry picking. I must admit that I didn’t previously realise just how much the AR5 estimates for climate sensitivity still rely on models, I nearly lost count of the times I wrote ‘models again’ in the margin.

    The biggest question that comes to my mind is why, if the approach used is an energy budget method, is only the change in surface temperature (dT) used and not a metric of total atmospheric energy such as moist enthalpy? I realise the paper follows the AR5 approach but in that case why does AR5 only use temperature?

    I keep asking this sort of question and never seem to get any sort of answer, I assume it may be simply because of a lack of humidity data, but surely that adds another level of uncertainty to the whole picture? Can the additional uncertainty be quantified in any way?

    I’m perfectly willing to be shot down about this if I am on the wrong tack, but if so I’d like to know why.

    • Temperature determines radiation. Not that surface temp is a very good proxy for radiation over the total depth (including absorption), but “moist enthalpy” doesn’t, AFAIK, control anything about radiation (except for a change to the greenhouse effect).

      • But AK, moist enthalpy is a measure that gets closer to the total amount of energy in the atmosphere than temperature alone does. And we are talking about energy budgets, so surely this matters?

      • Total energy is what would determine the total radiant green house effect. If the actual “surface” happens to be 15 C or 390 Wm-2 equivalent after about 100 Wm-2 of latent and convective cooling, the effective temperature of the surface would be about 31 C degrees(@490Wm-2 equiv.). The moist enthalpy with related convection amounts to about 16 C of surface cooling/atmospheric warming.

      • Matthew R Marler

        Jonathan Abbott: But AK, moist enthalpy is a measure that gets closer to the total amount of energy in the atmosphere than temperature alone does. And we are talking about energy budgets, so surely this matters?

        I think that is one of the “known unknowns” that is finessed in a lot of the calculations.

        Besides the total energy at any time, there is the question of the rate of transfer of energy as the warm moist air rises and the water freezes in clouds and returns to the surface. This is in the energy flow diagrams (Trenberth et al, Stephens et al), but so far I have only found one paper that addresses the question of how that will change as CO2 increases.

    • It is one of the questions I suppose. I’ve not read the paper on principle.

      However – latent heat is a significant component of energy transport at the surface and varies with water availability on land. Hence the land/ocean contrast.

      It makes the surface records obsolete for climate monitoring purposes – but don’t tell anyone – they might think I am outside the tent pissing in.

  54. Question for Nic and Judith about transient vs equilibrium climate response.

    Hans Erren above linked to a graphic from the IPCC comparing the two:

    http://www.ipcc.ch/ipccreports/tar/wg1/images/fig9-1s.gif

    To look at the responses to a doubling of CO2, TCR happens at about year 70, ECR is completely baked in by about year 150, but the red line — which I interpret as actual temps — never gets to ECR in 500 years.

    If so, ECR is almost meaningless for a doubling of CO2, because it is unimaginable to me that we won’t have cost effective solar, for use on buildings, a few decades from now, or that we won’t have any manner of new and more efficient technologies within a few decades. It is unimaginable to me that there will be anything like business as usual, starting two or three decades from now. The rate of technological change and discovery is the greatest the world has seen at this point. And if that is true, there will be countervailing measures which should lower the red line going forward. Thus we never get to ECR, never mind that it would take over 500 years to get there according to the graphic.

    Am I reading the graphic correctly?

  55. Edward Burgener

    The Chinese will have nuclear. It will be so cheap the USA will, like Spain, price itself out of world markets.

    Such is the consequence of the “crazies” taking control, as Patrick Moore outlines. It’s not about science at all IMO.

  56. Looking at the graph in the linked article the graph shows that the image of lawyers is competent but cold whereas scientists are a bit more competent and a lot warmer and Engineers are even more competent and a bit warmer yet — more competent than the warmer doctors — just, not as warm as professors and teachers. Apparently, the most skeptical and questioning among us are perceived as lacking warmth; but, there’s a price to be paid for wanting so badly to be loved, even at the expense of truth, teachers… and, Socrates knew it.

    • Referring, of course to the Princeton study. As an Engineer, I like where we turned out on the scale as the most competent and above average warmness. We are rated higher in both by a bit than scientists. If I were to guess I would have said that we would have been rated higher in competence and lower in warmth, but that is not the case. When giving recommendations, it is important to me to maintain competence over warmth. That may not be the case in other professions. A doctor, for instance, may know that the competent answer to the question of “how much longer do I have” could be less useful to his client than a warm but less competent non-answer. In engineering the less competent, warmer answer is normally very costly. As for the whole need to be warm to be trusted thing, I am not sure that applies to Engineers or Lawyers. I don’t care how much I dislike my lawyer, I am going to listen to him.

      • True, true, you can trust that the lawyers have at least, read the rules printed under the lid of the box and, like the scientific method, that’s a good place to start when there’s a decision to be made and there’s a dispute over the facts.

  57. Climate sensitivity, W/m2/K, is for many, myself included, the key to answering some key climate questions. It’s a pleasure seeing its return to this forum. I’m still working through the 20 pages, but the focus on the differential ratio of an energy flux density at one interface to a temperature at another interface is most encouraging. Mathematically, it would appear that ‘transient’ sensitivity is a first-order partial derivative and ‘equilibrium’ sensitivity its total derivative. (I welcome the day when climatologists refrain from using the word equilibrium. The atmosphere is, at best, approximated by a nonlinear steady state far from equilibrium. A steady state is always trying to relax towards a true equilibrium (isothermal) and requires a constant expenditure of energy, dissipation, to keep it from doing so.)

    I’m not aware that it is common knowledge that MODTRAN programs can calculate the change in outgoing radiant energy as a function of a change in surface temperature, all other factors held constant. A few moments with David Archer’s online program returns a value of 3.4W/m2/K for US Std Atm parameters. The 3.7W/m2/K value associated CO2 doubling then leads to a 1.1K surface change, matching the Lewis-Curry results. (Dividing tropospheric dissipation by the difference of its bounding temperatures (240/70) also gives 3.4, a result hardly coincidental.)

    But there’s a bit of a problem. The MODTRAN program holds the lapse rate constant. There are two classes of processes involved in transport, those dependent on temperature (radiation) and those dependent on thermal gradients (convection). Convective flux dominates near the surface, where GHG concentrations are greatest, and transforms to radiant flux with increasing altitude. The lapse rate constraint implies constant convection. Intuitively, one would expect increased convection to partially compensate for decreased radiative flux and so reduce climate sensitivity values.

    The Lewis-Curry results, as I so far understand, follow from IPCC values for forcings and temperature changes. The latter are experimental and should reflect convective effects, so there’s an interesting problem at hand.

    • You write: “The MODTRAN program holds the lapse rate constant. [snip] The lapse rate constraint implies constant convection. Intuitively, one would expect increased convection to partially compensate for decreased radiative flux and so reduce climate sensitivity values.”

      This is crucial. To have a realistic model of the atmosphere, the lapse rate must be calculated layer-by-layer. This requires knowledge of moisture content layer-by-layer, and how moisture content responds to changes in surface temperature, a “wicked” problem. Most of the moisture is found below about 10,000 feet, so that is where the effect of changes in lapse rate will be felt, and the effect of an increase in moisture is to decrease the near-surface lapse rate, potentially resulting in an important negative feedback on radiative forcing. A model that does not deal with this problem is incomplete, so say the least.

    • Matthew R Marler

      Quondam: (I welcome the day when climatologists refrain from using the word equilibrium. The atmosphere is, at best, approximated by a nonlinear steady state far from equilibrium. A steady state is always trying to relax towards a true equilibrium (isothermal) and requires a constant expenditure of energy, dissipation, to keep it from doing so.)

      But there’s a bit of a problem. The MODTRAN program holds the lapse rate constant. There are two classes of processes involved in transport, those dependent on temperature (radiation) and those dependent on thermal gradients (convection). Convective flux dominates near the surface, where GHG concentrations are greatest, and transforms to radiant flux with increasing altitude. The lapse rate constraint implies constant convection. Intuitively, one would expect increased convection to partially compensate for decreased radiative flux and so reduce climate sensitivity values.

      Those points have been made by a number of authors. I can’t tell if they are gaining adherents.

    • “Climate sensitivity, W/m2/K, is for many, myself included, the key to answering some key climate questions”

      Imagine, like Dr. Evil, you have access to a giant, tunable laser located on a giant, fast moving hover ship, and you can radiate the Earths surface with, on average, 10 W/m2 of radiation.
      Do you get the same about of heating if you radiate with exactly the same power, uv, blue, green, red, near IR or far IR radiation?

      • The answer is implicit in this old post at RC:
        http://www.realclimate.org/images/Minnett_2.gif
        And another thing: when you “radiate the Earths surface” is it roughly even over the surface, or is it at a similar angle to Solar irradiation? Including seasons?

      • DocMartyn,

        I’m assuming your question is rhetorical.

        Most people won’t know the answer, or the caveats that apply. The Warmist response is furious handwaving and pseudo-scientific nonsense about absorption spectra, thermalisation, and so on.

        It might be easier for some if I use a different unit of energy, the calorie. People can relate to the calorie, because it is defined as the amount of energy required to raise the temperature of a specific quantity of water by a specific amount. Calories, watts, joules, and all the rest are measuring the same thing, and are fixed in relationship to each other.

        It will be noted that the definition of the unit of energy called the calorie contains no reference to the wavelength of the radiation which transfers the energy – IR, UV, X Ray, all transmit energy. One calorie of energy radiated by any wavelength is defined equally. As do the watt, the joule, and all the rest.

        The problem arises when light (Einstein usage) interacts with matter, and transmitting one calorie of energy may not result in what you expected. Did the matter at which it was aimed absorb it, and react in a way that resulted in an interaction with your measuring equipment allowing you to measure a temperature rise?

        As an example, the phenomenon of total internal reflection of any wavelength demonstrates that large amounts of energy can impinge on matter in such a way that almost all is reflected, the absorption by the walls being essentially zero (but not quite).

        So, if you are able to transmit your one calorie of energy with perfect efficiency into one gram of water under specified conditions, the temperature would rise by one degree C (from memory). Will it happen? It obviously depends on the absorptivity of your target at the frequency in question. The greater the absorptivity, the more efficient the energy transfer.

        To complicate the issue, the only truly transparent medium for light is a vacuum – which is the complete lack of any medium at all. This is why Einstein specified the speed of light as that which occurs in a vacuum. I have simplified things a bit, because on the quantum level, everything exists in a vacuum, and therefore light travels at its invariable speed. People will point to normally experienced phenomena such as reflection, refraction, dispersion, transparency and so on, without realising that at a low level things such as a flat reflective surface don’t exist.

        It is quite possible for someone to believe that some wavelengths of light slow down more than others when refracted, giving an intense rainbow, then magically speed up again until once again they are all travelling at the same speed in a vacuum. Einstein and Feynman have a slightly different explanation, which makes more sense to me. Maybe we are all wrong.

        So back to your original question – what part of the Earth? Are there clouds in the way? Is the radiation impinging at greater or less than Brewster’s angle? And so on.

        I’m sure a Warmist can provide you with a condescending, supercilious, and patronising answer which happens to be incomplete, useless, wrong, or all three. They haven’t got a clue in most cases, which is why they hide behind the non science known as Climatology.

        Heat is a wonderful thing.

        Here are just five dictionary definitions of temperature –

        The degree of hotness or coldness of a body or environment.
        A measure of the warmth or coldness of an object or substance with reference to some standard value.
        A measure of the average kinetic energy of the particles in a sample of matter, expressed in terms of units or degrees designated on a standard scale.
        A measure of the ability of a substance, or more generally of any physical system, to transfer heat energy to another physical system.
        Any of various standardized numerical measures of this ability, such as the Kelvin, Fahrenheit, and Celsius scale.

        Definitions of heat are numerous. Pick one that suits the circumstances.
        Energy likewise.

        Apologies for going on a wee bit. The subject is not as simple as some might indicate, at least to me.

        Live well and prosper,

        Mike Flynn.

      • It is a question that is easy to answer in a senseless and facile way – and I see Flynn obliges.

        Most people won’t know the answer, or the caveats that apply. The Warmist response is furious handwaving and pseudo-scientific nonsense about absorption spectra, thermalisation, and so on.

        Most people obviously includes Flynn.

        In a perfect blackbody – the frequency would make no difference. But in the real world there is reflection and absorption and emission in the atmosphere and at surfaces. These physical properties are different at different frequencies. Meaning the results of the same quantum of energy is different at different frequencies.

        It might be easier for some if I use a different unit of energy, the calorie. People can relate to the calorie, because it is defined as the amount of energy required to raise the temperature of a specific quantity of water by a specific amount. Calories, watts, joules, and all the rest are measuring the same thing, and are fixed in relationship to each other.

        It might be easier and much more precise to use the International System of Units in which there are 7 fundamental units and relevant, power and energy and heat capacity units are derived via the 2nd law of motion.

        http://en.wikipedia.org/wiki/International_System_of_Units

        ‘It will be noted that the definition of the unit of energy called the calorie contains no reference to the wavelength of the radiation which transfers the energy – IR, UV, X Ray, all transmit energy. One calorie of energy radiated by any wavelength is defined equally. As do the watt, the joule, and all the rest.

        Watts and Joules have different units and a different interpretation. Power (W) is what is generally measured – it is work/time. A Joule is one Watt for one second and is a unit of energy – heat or work.

        The problem arises when light (Einstein usage) interacts with matter, and transmitting one calorie of energy may not result in what you expected. Did the matter at which it was aimed absorb it, and react in a way that resulted in an interaction with your measuring equipment allowing you to measure a temperature rise?

        Light is defined conventionally by physicists as electromagnetic emissions of any frequency and not merely the visual. Energy is transferred to molecules of which the translational kinetic energy – or kinetic temperature – is one component.

        ‘It is important to note that the average kinetic energy used here is limited to the translational kinetic energy of the molecules. That is, they are treated as point masses and no account is made of internal degrees of freedom such as molecular rotation and vibration. This distinction becomes quite important when you deal with subjects like the specific heats of gases. When you try to assess specific heat, you must account for all the energy possessed by the molecules, and the temperature as ordinarily measured does not account for molecular rotation and vibration. The kinetic temperature is the variable needed for subjects like heat transfer, because it is the translational kinetic energy which leads to energy transfer from a hot area (larger kinetic temperature, higher molecular speeds) to a cold area (lower molecular speeds) in direct collisional transfer.’ http://hyperphysics.phy-astr.gsu.edu/hbase/kinetic/kintem.html

        As an example, the phenomenon of total internal reflection of any wavelength demonstrates that large amounts of energy can impinge on matter in such a way that almost all is reflected, the absorption by the walls being essentially zero (but not quite).

        Some things are good at reflecting energy – some aren’t. Depends on the frequency as well.

        So, if you are able to transmit your one calorie of energy with perfect efficiency into one gram of water under specified conditions, the temperature would rise by one degree C (from memory). Will it happen? It obviously depends on the absorptivity of your target at the frequency in question. The greater the absorptivity, the more efficient the energy transfer.

        In the original application heat was applied to water in the way of a burning substance and the change in temperature noted. These days a calorie is taken to be about 4.286 Joules. The energy has to be actually transferred to the water.

        To complicate the issue, the only truly transparent medium for light is a vacuum – which is the complete lack of any medium at all. This is why Einstein specified the speed of light as that which occurs in a vacuum. I have simplified things a bit, because on the quantum level, everything exists in a vacuum, and therefore light travels at its invariable speed. People will point to normally experienced phenomena such as reflection, refraction, dispersion, transparency and so on, without realising that at a low level things such as a flat reflective surface don’t exist.

        Einstein was interested in the invariance of the speed of light wrt inertial frames of reference. The medium doesn’t really matter as long as it is the same for each inertial frame. It is not that the speed of light is invariant – it isn’t. Quantum nonsense notwithstanding.

        Reflective surfaces can be manufactured for a wide range of frequencies. They reflect at specific frequencies and I am clueless as to what low levels of something might mean.

        It is quite possible for someone to believe that some wavelengths of light slow down more than others when refracted, giving an intense rainbow, then magically speed up again until once again they are all travelling at the same speed in a vacuum. Einstein and Feynman have a slightly different explanation, which makes more sense to me. Maybe we are all wrong.

        http://www.youtube.com/watch?v=FAivtXJOsiI

        I’m sure a Warmist can provide you with a condescending, supercilious, and patronising answer which happens to be incomplete, useless, wrong, or all three. They haven’t got a clue in most cases, which is why they hide behind the non science known as Climatology.

        The usual crapology from someone who has not the slightest clue and pulls it out of his arse. I hate that equally from either side of the climate war – which is why I waste so much time on nonsense like this.

      • Eh – that’s 4.186 Joules for the quibblers…

      • –Imagine, like Dr. Evil, you have access to a giant, tunable laser located on a giant, fast moving hover ship, and you can radiate the Earths surface with, on average, 10 W/m2 of radiation.
        Do you get the same about of heating if you radiate with exactly the same power, uv, blue, green, red, near IR or far IR radiation?–

        About the same heat made. But not the same temperature increased.
        10 W/m2 radiation over a square meter is not going to heat anything up by much. Or square meter is 100 cm by 100 cm, so has 10,000 square cm, and per square cm one can at most can add .,001 watts or .001 joules of heat per second. For a cubic cm of water to warm by 1 C requires 4.2 joules. So it would require 4200 seconds to warm that cubic centimeter of water by 1 C- this assumes total absorption of energy within the cm depth and not any loss of that gained heat in the over hour of shining the light on it.
        So to clear 1 meter square and at depth of 1 cm.
        If instead of heating to cm depth you heating to a depth of only 1 mm [something remotely possible with far IR] then it takes a 1/10th of the time. So, 420 second [7 mins]. So if on shined that laser on a square meter for say 10 mins then the 1 mm depth of square meter could warm by about 1 C.
        Rather than water one could also heat up anything with a thin surface [and assuming one reduces the heat loss] So thin sheet of paper which absorbs [has heat capacity of whatever wavelength one is using could heated within mins of exposure. So Cotton 0.32 kJ/kg K) as compared
        to water: 4.210 kJ/kg K. So cotton paper 1 mm thick takes about 1/13th of the time. Or about 32 seconds rather than the 420 seconds.

        And with right wavelength say, uv , one can add to energy of sunlight- so if sunlight warming a section sidewalk so it’s 70 C. So if shined it on this sun lit sidewalk after few minutes one add about 1 C. This could also applied to visible light and near IR which the energy of the sunlight one is adding to. Or if sunlight is 1000 watts square , one would be making equal 1010 watts per square meter.
        Or there is a limit to how hot 1000 watts of sunlight could make sidewalk warm up to [even if one could reduce convection and conduction losses]
        but 1010 watts would have higher temperature that it’s limited to. It not going to add much temperature, perhaps as much as say 1 C to max.
        In terms far infrared, I don’t think it could add to sunlight’s max temperature of the sidewalk at 70 C.

      • Rob Ellison,

        I believe you.

        Einstein was wrong.

        The Earth is warming.

        The sky is falling.

        We are all doomed.

        In the meantime, I enjoy a quiet life – content, if you want to express it that way. Feel free to broadcast despair, despondency and imminent disaster if you wish. I don’t really care. Obviously you do, and I wish you well.

        You are right – I am wrong – (cue sarcasm and uncontrollable sniggering – I know, unworthy of me, but even so . . . ), and still Nature refuses to go along with the Warmist Manntra.

        Sorry Rob, you’re wrong – I’m right. The Earth is cooling. All I have on my side are observation, physics, theory and Nature. Warmists have religious
        fervour, handwaving, and Dr Fraudpants.

        Who really cares?

        Live well and prosper,

        Mike Flynn.

      • Einstein was wrong wrt inertial frames of reference. No I don’t think so. Flynn simply didn’t understand the nature of relativity and babbled on pompously about this and other things he simply imagined was the case – but isn’t.

        He then goes off on a sceptic rant with much handwaving and sniggering but no substance at all as usual. People like this are an embarrassment to skepticism.

      • Rob Ellison,

        You wrote –

        “He then goes off on a sceptic rant with much handwaving and sniggering but no substance at all as usual. People like this are an embarrassment to skepticism.”

        As I have mentioned to you previously, I regard myself as a non-believer when it comes to global warming. My reason is fairly obvious – the Earth is not warming. I am not normally afflicted with attacks of sniggering, but I occasionally allow my the luxury of a good snigger or two, usually after someone attempts to browbeat me with patronising, condescending, tendentious Warmist dogma – particularly if it’s demonstrably nonsensical.

        As you may have noticed, I’m rather partial to facts. You may consider me an embarrassment – that is your right.

        It still won’t help to stop the Earth from cooling, will it?

        Live well and prosper,

        Mike Flynn.

  58. In JC remarks:
    Further, there was ‘something else’ going on in the latter 19th and early-mid 20th century that was causing warming, that does not seem to relate directly to external forcing.

    Ice Extent has been decreasing, most of the time, since the coldest part of the Little Ice Age. That does reduce Albedo and does promote warming. Recently, the warming oceans melted polar sea ice and turned on Ocean Effect Snow that has halted or paused the ice retreat. If you included Polar Ice Cycles in your climate models and included more snowfall when polar oceans are thawed and included less snowfall when polar oceans are frozen, the models would work much better. They would stay in bounds, like real actual Earth Temperature and Sea Level data.

    Look at snowfall in the cold season after a record open Arctic and compare snowfall in the cold season after a less open Arctic. This shows up in year to year data. Tom Wysmuller has lectured about this many times and he did again yesterday. He said, it snowed in Egypt and the Holy Land, after a record Open Arctic.

    Polar Ice Cycles do the regulation and fine tuning of Earth temperature and Sea Level. It always snows more when Polar Oceans are warm and thawed and it always snows less when the Polar Oceans are cold and frozen. There are also more clouds when Polar Oceans are warm and thawed. There are always less clouds when Polar Oceans are cold and frozen.

  59. @ Judith

    Your interpretation of your own work ist wrong, because you claim the falsche Statement of IPCC. Your work, will perhaps be get into this Section:
    “Estimates of Climate Sensitivity Based on Instrumental Observations”

    And what this Section of IPCC say about ECS:
    “Most studies suggest a 5th percentile for climate sensitivity of 1°C or above”

    And were is your Works 5th percentile ? Its 1.05K and in this fact, you are not disagree with IPCC-lower-range (that your have claim out), but you agree with the last resport.

  60. Judith: Assuming that half of the warming since 1950 were due to unforced variability, wouldn’t that make TCR about 0.65 degC. Do you believe TCR can be this low? If not, how do you reconcile your opposition to the IPCC’s attribution statement with your belief about TCR?

    IMO, evidence exists showing that unforced variability could be large enough to have contributed about 50% of warming since 1950. However, since observations of OLR from space aren’t consistent with an overall negative feedback and TCR<1. Therefore, it appears as if unforced variability happened to not be this big since 1950.

    • blueice2hotsea

      Frank

      Look at this graph. The red line is an anthro secular trend which yields a sensitivity of around 1.33. The slope of natural variability increases around 0.20 degrees from 1878 to 2007.

      So, 50% natural from 1950 to 2007 is consistent with 1.33 sensitivity.

    • blueice2hotsea

      Frank –

      Adding the secular and natural trends yields approximate linearized temp trend.

      Hope that helps.

      bi2hs

  61. Or if you look at WGI_AR5 Box 12.2-1

    Here the Link: http://www.climatechange2013.org/images/figures/WGI_AR5_FigBox12.2-1.jpg

    You see, that most of instrumental based ECS lower range is under 1.5K as above 1.5K.

    In my opinion, your work is totaly according with the new IPCC-Resport

    Greets

    • Chris, you missed the point. Look at the “combination” in your cited figure and look at mosh’s comment: http://judithcurry.com/2014/09/24/lewis-and-curry-climate-sensitivity-uncertainty/#comment-632605 and you’ll approach the problem!

      • Do i really?, another point is, that Nic and Curry use Hadcrut4 and since 2013 (Cowton and Way) we know that this underestimated the increase of temperature. I ve done this with Nic and Curry approach and ECS-Best is increased to 1.8K.

        Next is, the last word about recent Forcing is not spoken, there is some kind of evidence, that Forcing is lower for the 2000s then previous thought.

        Another point is, that the imply of heat-uptake, made by Nic and Curry underestimated thermal sea level expansion for 1995-2011, would it be correct, heat-uptake in cyrosphere inclusive glacier-melting have to be larger then thought. And Nic and Lewis just said: “Heat uptake by other components of the climate system is ignored”

        If this true, dQ of Nic and Curry were biased down, because they didnt look for Full System Heat-Uptake.

        But its okay, because the Work of Nic and Lewis are not about real ECS, but only the effective sensivity and thats why based on this concept the range variers from 1K to 10K

        Greets

  62. Pingback: Climate Sensitivity | Transterrestrial Musings

  63. Antonio (AKA "Un físico")

    Lewis, Crok and now you Curry, are wrong about climate sensitivity values. I have no time for correcting that pdf (step by step; point by point) with a long comment as I used to. So please, read my:
    https://docs.google.com/file/d/0B4r_7eooq1u2TWRnRVhwSnNLc0k/
    Spetially Chapter 3. You three lads, are smart enough to correct youselves (if you want to).
    Regards, Antonio.

  64. Pingback: Quote of the Week – models, climate sensitivity, the pause, and psychology | Watts Up With That?

  65. I am surprised that anyone went along with the deceitful and foolish Copenhagen decision to define climate temperature by itself. I refer to the decision to define sensitivity as the supposed temperature rise due to a doubling of the concentration of carbon dioxide. It w=as deceitful because no one could check it until a century hence when CO2 would supposedly be doubled and the 1940 singularity showed that climate had an on/off character that precluded labelling it as a constant.

    Of course this foolish decision was made on the back of another foolish decision: that climate science was ‘settled’. So the whole structure will collapse like a house of cards, pretty soon.

    • In naychur
      lots of swamps
      of despond
      in which ter
      get mired.

      • Beththeserf: Thanks. I hope you don’t get swallowed by those dangerous swamps. If you did we’d miss your poetry. But a lifetime has taught me that if you don’t take risks you never achieve anything. I ought to know: my wife was a poet.

    • Agree AB that life is about taking risks, I was referrrng ter yr
      ‘foolish decisions’ piggy backed on other ‘foolish decisions.’
      in naychur yr pay fer feckless decisions, Grimms Fairy Stories
      had case studies. Maybe one day yr might post one of yr wife’s
      poems. bts

  66. Mosher pleads: “By giving up the hoax crap, by ignoring Mann, and by working within the framework that the Equation describes.”

    Mann is pivotal here for in 2013 an utter fraud of a new Mann-vindicating hockey stick garnered wide media attention, and in doing so further exposed the core climate “science” theory that recent warming is unique, wheras with the fraud revealed we have precedence many times in the past in a way that suggests recent warming could also be mostly natural as negative feedbacks and a near permanent ocean heat reservoir entropically disperses captured greenhouse heat into mere hundredths of a degree that Curry pointed out cannot by the law of entropy come back out again in concentrated multiple degree fashion. Wouldn’t Mosher’s ongoing career and reputation ever be helped by covering up the Marcott 2013 fraud that exposes all of climate “science” as fully peer review and ethically corrupted! In fact *only* skeptical papers stand the rigor of normal science exactly due to biased peer review against them, yet they still get published. All other climate papers stand highly suspect until Marcott is retracted and the investigators involved all are fired. That’s exactly what would happen in genetics or AIDs or cancer research for the equivalent level of outright positive result fabrication, sometimes with criminal charges added.

    http://s28.postimg.org/7d9isipx9/image.jpg

    -=NikFromNYC=-, Ph.D. in carbon chemistry (Columbia/Harvard)

    • NikfromNY,

      I am curious about your degree in ‘carbon chemistry’. Does this involve geoscience or is it more like organic chemistry? It sounds like a valuable degree in this day and age regardless. Nice to have your input.

  67. Aaaahhh, climate sensitivity!!! If you know its value you know how much global warming you get when you double the amount of carbon dioxide in the atmosphere. Arrhenius figured it was about four or five degrees Celsius. Modern day recalculation, using mpore accurate values of parameteers, gives it a value around 1.1 degrees Celsius. That is of course non-threatening so the brains at IPCC decided that water vapor feedback might double or triple that and so get a danger level of 2 to 3 degree warming from doubling of carbon dioxide. \it all hangs on the greenhouse effect of carbon dioxide added to the atmosphere. If there was no greenhouse effect or if something were to block it any doubling of carbon dioxide would yield zero degrees warming and the water vapor feedback likewise would be zero, giving a climate sensitivity of exactly zero for this doubling. I am going to argue that this is exactly what it is, despite carbon dioxide being a greenhouse gas. A greenhouse gas is expected to work its warming through the greenhouse effect, absorbing infrared radiation and converting it to heat that warms the atmosphere. Hansen told the Sensate in 1988 that he personally had detected the greenhouse effect by observing a hundred year warming thayt could not have happened by pure chance. He was wrong, of course, because thirty of his hundred years were not greenhouse years, and another thirty were cooling, not warming. But ever since that we have been told that the greenhouse effect is responsible for causing the anthropogenic global warming or AGW. Thgis blanket rule flies in the face of actual temperature observations today. There has been no warming for the last 17 years but atmospheric carbon dioxide just keeps increasing on its own schedule. There is not a dent in the Keeling curve seventeen years ago that would indicate it even knows about this. We have a greenhouse theory of course that predicts warming when carbon dioxide goes up. It has been predicting warming all these 17 years and getting nothing. If you are a scientist and your theory predicts warming but you get nothing for 17 years you are justified in throwing that theory into the waste basket of history. There is spot there for it, right next to phlogiston, another theory of warming that failed. With that, the only greenhouse theory still left standing is the Miskolkczi greenhouse theory, MGT. It predicts exactly what we see: addition of carbon dioxide to the atmosphere does no earm the air. It came out in 2007 but was promptly blacklisted by the IPCC. That is why you have not heard about it. It is capable of handling several GHGs that simultaneously absorb in the infrared, something the Arrhenius theory cannot do. In the earth atmosphere the two most important greenhouse gases are water vapor and carbon dioxide. According to MGT they form a joint IR absorption window which they control. The optical thickness of this window in the IR is 1.87, determined by Miskolczi from first principles. If you now add carbon dioxide to the atmosphere it will start to absorb, just as the Arrhenius theory says. But this will increase the optical thickness. And as soon as this happens, water vapor will begin to diminish, rain out, and the original optical thickness is restored. The introduced carbon dioxide will of course keep absorbing but simultaneous reduction of water vapor will keep total absorption constant and no warming takes place. This is the explanation of why there is no warming today despite a constantly increasing atmospheric CO2. This fact has great importance for climate science. First, it makes any runaway greenhouse effect impossible. This explains why very high carbon dioxide in geologic history never caused any runaway warming. It also takes care of Hansen who has been warning us that burning fossil fuels will lead to runaway greenhouse like what happened to Venus. He is wrong, both about us and about Venus. Secondly, it makes the enhanced greenhouse impossible. Since that is touted to be the cause of AGW it follows that AGW itself does not exist either. It is nothing but a pseudo-scientific fantasy, invented by some over-eager climate worker to justify the greenhouse hypothesis. To summarize: Hansen did not discover the greenhouse effect; the greenhouse effect is not the cause of AGW; the AGW is itself a pseudo-scientific fantasy; no runaway greenhouse effect is possible in the presence of water vapor; and finally, the true value of climate sensitivity is zero.

  68. Nic has been doing a lot of good work and I’m happy to see him get the chance to publish. Congrats to him and Dr. Curry on the paper. I hope to have time to read all of it later.

  69. Pingback: E’ tutta questione di sensibilità | Climatemonitor

  70. Well done Nic and Judy. This is excellent.

    What a pity Manacker (Max Anacker) isn’t here to appreciate and enjoy this work. He wasn’t a gloater, but he’d have too feel pretty good inside about his many comments on this subject.

  71. I have been reflecting on this sensitivity house of cards. Quite apart from the absurdity of arguing against truth in favour of being inside the teetering structure — it is a preeminent brittle structure — whether arguing high or low sensitivity — because that’s what the punters want to hear — on a blog where science is meant to mean something and the policy nexus is in another room anyway.

    I am not sure where I got this staccato style — with the heavy use of the em dash — but I like it a lot. It comes with being a drama queen. ‘The Em Dash: This punctuation mark is the most interesting because its use can create heightened drama. For that reason it’s being used more often by modern fiction writers. This type of dash is a mark of separation, not of words but of phrases and thoughts.’ http://jamesjmurray.wordpress.com/2012/09/26/hyphens-and-dashes/

    But I digress — AK quoted James Hansen — predicting catastrophic climate tipping points. We all knew it was coming – but prediction is far from the right spirit to approach tipping points with. It is more like a log-Pearson distribution with high probability events to the left and a trailing tail of increasingly low probability high impact events.

    The question is — does either high or low sensitivity do justice to the probability distribution function of abrupt climate change? Does either encourage the development of the right policy settings? Low sensitivity captures the low impact side of the distribution – and is likely to be used to justify business as usual. Come on — you know who you are. High sensitivity captures the high impact side of the distribution — but discounts the higher probability low impact events. Both sacrifice the uncertainty monster on the altar of ideological mediocrity.

    https://watertechbyrie.files.wordpress.com/2014/06/monster-reading-a-book.png

    Poor little thing. . .

    • Here’s a thought about “tipping points”:

      Let’s start by assuming that by “tipping point” you mean crossing from one general basin of attraction to another. Recognizing that when the attractor, and its nearby basin, is mapped in a space where the important dimensions are relevant to our needs (e.g. agricultural) there can be low-probability branches that cross from one area to another. There are probably multiple attractors, certainly multiple branches of some attractor(s) (whether the same or different), in any area that is coherent in terms of our needs.

      Consider the collection of attractors and associated basins to be found at any point in the seasonal cycle, as if the earth were stalled in its orbit at that polar inclination. The instantaneous state of the climate would progress along a particular attractor, wandering around state-space and approaching other attractors at times.

      But the seasons advance, of course. Does that mean that, as the sun moves north and south, the weather is pushed across a progression of “tipping points”? With the determination of which tipping point depending on the precise correlation of seasonal “forcing” with location along the attractor?

      That makes sense to me. In fact, I can’t off-hand think of any reason that wouldn’t be an accurate representation of what happens. That being said, how does it change our perception of “tipping points” in annualized weather, or climate?

      A similar point could be made about short-term multi-annual phenomena such as ENSO: the annual seasonal cycle interacts with the evolution of whatever factors are involved with ENSO, with the precise determination of the outcome depending on exactly how the seasons line up with that evolution.

      Should we think of the ENSO “oscillation” as representing “tipping points” crossing from one basin of attraction to another? Seems right to me, but…

      • Despite the focus on “a number,” the science provides a range. Which, if course, is what the focus on “no regrets” (often) fails to take into account.

      • There’s always a chance of something going horribly wrong.

        We don’t have any idea of the probability, except it’s probably low.

        How much sacrifice “we” want to make to deal with that “chance of something going horribly wrong” is really a political decision. Personally, I don’t think it’s worth more than “low-regrets” measures. But others are entitled to their opinions.

        My best guess is that the vast majority of people in any culture, developed or developing, aren’t really in favor of (much) more than that. That’s why the people pushing for “high-regrets” measures need to scare them by distorting/lying about the science. They certainly seem to think the majority aren’t interested in more.

        Especially since, AFAIK, even the most extreme measures studied by the IPCC don’t really offer more than a tiny benefit over well thought out “low-regrets” approaches.

        Of course, “regrets” depends on your political ideology. If you regard imposing on the world a world-wide micro-regulatory bureaucracy open to subversion of the sort practiced by Lenin as a good thing™, then your definition of “low-regrets” will be different from the rest of us.

      • Science provides a range. Policy ignores it or picks an extreme to justify action.

      • Mosh, “Science provides a range. Policy ignores it or picks an extreme to justify action.”

        Right. So asking for an extreme, like the absolute worst of worst cases or best of all possible worlds gives the politician leverage. Reducing uncertainty isn’t all that good of a thing politically. You end up with policy driven by fantasies and nightmares. Kinda leaves the pragmatic out in the cold. Before long you have lots of Joshuas running around :)

      • I lie the concept of “low regrets” – it seems more realistic than the theoretical construct of “no regrets” – which seems to me to be more out a rhetorical tool than a practical policy tool.

      • Like, not lie…

      • > Policy ignores it or picks an extreme to justify action.

        which oftentimes is the less that Policy could do to justify having done something.

      • Just have to say how amusing it is that in the space of a couple of comments both Cap’n and AK talk of the weakness of leveraging extremism in policy formation while turning right around advocating just that.

        Nice work, boyz.

      • “My best guess is that the vast majority of people in any culture, developed or developing, aren’t really in favor of (much) more than that.”

        I’ve been saying for a long time that the policy debate has from the alarmist point of view, already been lost. On some level they know this, hence the increasing hysteria about the fate of the planet hanging in the balance.. But it won’t work. Nations are not going to impoverish themselves in order to “battle climate change,” which to the extent it exists remains abstract and in the relatively distant future. That’s why people like Leonardo Dicaprio feel the need to howl about how “climate change”
        is happening “right now.” Let ’em howl. I rather enjoy it.

      • Why Joshua? Because it is the truth? You won’t find any politician underselling its cause. Everyone should be aware of the reality, some just choose to ignore it, probably because they feel their side or their cause is above reproach.

        If climate change were a more “normal” crisis, the sides would be more willing to compromise on the low/no regrets path instead the strange nonsense we have going on now. As it is we have a crisis that isn’t following the “projections” so the gallant cause is losing its fan base.

      • “Like, not lie…”

        Freudian slip, joshie? Or is that what you would call unintended irony? Carry on with your foolishness, little dude.

      • I li[k]e the concept of “low regrets” – it seems more realistic than the theoretical construct of “no regrets” – which seems to me to be more out a rhetorical tool than a practical policy tool.

        I called it a “myth” a while back. Nevaudit might be able to find a link.

        Just have to say how amusing it is that in the space of a couple of comments both Cap’n and AK talk of the weakness of leveraging extremism in policy formation while turning right around advocating just that.

        I don’t understand how you think I’m “advocating just that.” I don’t recommend distorting the science, or hiding uncertainty. After that, everybody’s entitled to their opinion.

      • “Reducing uncertainty isn’t all that good of a thing politically. You end up with policy driven by fantasies and nightmares. Kinda leaves the pragmatic out in the cold. ”

        Yes, so for example, let’s take black carbon which the science shows us
        is
        A) a considerable forcing, second to C02 ( or third i cant recall)
        B) causes Immediate damage.
        C) both sides agree is something we should mitigate
        D) can be mitigated without global treaty.

        For an interesting read look at the following.

        Note: The small investment, the conservative assumptions about
        the benefits ( low $ for loss of life). Note the conservative
        assumptions about adoption.

        http://www.copenhagenconsensus.com/sites/default/files/ap_black_carbon_baron_montgomery_tuladhar_v.4.0.pdf

        In short, if we were as agressive about black carbon ( 40% of the problem)
        as we are about C02 you might see action.

        Why the lack of aggression on black carbon?

        There is NO corporate enemy to demonize and mobilize around

    • Hi Rob,

      You seem not to have many facts to support your case. First, you don’t know that the climate system is “brittle,” I suspect it is pretty malleable, but don’t have any proof other than that life has managed to survive this long. Secondly, I know of no research that tells us when/where the cusps in state space resided. We don’t know. And finally, no matter what we do or don’t do, the climate will still possibly be subject to catastrophic change. Based on what we know so far, those are due to comet/meteorite/asteroid strikes. The other changes are due to Milankovitch cycles.

      We are ignorant of many things, we can’t deploy a large quantity of resources based merely on fear.

      The more I think about it, I’m coming to believe that the difference between skeptics and warmists does not lie on the political spectrum. Instead it seems to depend instead, at least for global warming, to be determined on the risk-taking/fear scale, and/or the optimist/pessimist scale.

      • You seem to be reacting more to your own ideology than what he said:

        First, you don’t know that the climate system is “brittle,” I suspect it is pretty malleable, but don’t have any proof other than that life has managed to survive this long.

        The “preeminent brittle structure” is obviously the linear (sub-)paradigm based on “climate sensitivity”. Not the climate system itself (in this comment, anyway).. Read harder.

        Based on what we know so far, those are due to comet/meteorite/asteroid strikes. The other changes are due to Milankovitch cycles.

        Nope.

        We are ignorant of many things, we can’t deploy a large quantity of resources based merely on fear.

        That’s hardly the same principle as “justify[ing] business as usual.”

        I’m coming to believe that the difference between skeptics and warmists does not lie on the political spectrum. Instead it seems to depend instead, at least for global warming, to be determined on the risk-taking/fear scale, and/or the optimist/pessimist scale.

        I simply don’t understand why you can’t see the broad middle ground between “deploy[ing] a large quantity of resources based merely on fear”, to the major detriment of prosperity and economic happiness, and taking a bunch of “low-regrets” precautions such as targeted incentives for R&D with a good chance of “pre-solving” the problems.

        Seems like a very binary perspective to me.

      • OOps! That last paragraph should have read:

        I simply don’t understand why you can’t see the broad middle ground between “deploy[ing] a large quantity of resources based merely on fear”, to the major detriment of prosperity and economic happiness, and “business as usual.”. Such as taking a bunch of “low-regrets” precautions such as targeted incentives for R&D with a good chance of “pre-solving” the problems.

      • AK, so you believe Rob is saying the sensitivity can be expected to change catastrophically? That’s not the way I RE-READ it. Anyway, even if that’s what he meant, it still would be reflected in climate.

        I love “nope” as an argument. Definitive, that.

        Finally, I have advocated time and time again for the low regrets action to streamline nuclear reactor development, licencing, and construction.

        It’s just that the eco-loons don’t like it.

      • AK, so you believe Rob is saying the sensitivity can be expected to change catastrophically? That’s not the way I RE-READ it.

        Nope. He’s saying that the current paradigm based on a fixed sensitivity “is a preeminent brittle structure”. In order to measure/estimate/guess a “sensitivity”, you have to start by assuming that some such number exists, makes sense. It doesn’t. Mosher’s argument is that whether or not such a number makes sense, the customers for political advice insist on a number.

        I love “nope” as an argument. Definitive, that.

        Yup. If you actually read the literature on such external “causes”, you’ll find a bunch of guesswork founded on a tacit assumption that there must have been an external cause.

        But studies of complex non-linear systems, much less hyper-complex non-linear systems, demonstrate that low-probability changes of this sort can occur without any external cause. And I doubt there’s any more hyper-complex non-linear system in Solar orbit than the terrestrial ecosystems made up of evolving species.

        Finally, I have advocated time and time again for the low regrets action to streamline nuclear reactor development, licencing, and construction.

        It’s just that the eco-loons don’t like it.

        Actually, the warmist crowd seems to be splitting in two over the issue. (CF Hansen, etc.) Personally, I don’t have a problem with the streamlining you propose, although I’m convinced solar will beat it hands down.

        But who knows? I could be wrong; always good to have another string to your bow.

      • ” Mosher’s argument is that whether or not such a number makes sense, the customers for political advice insist on a number.”

        Yup. So, you better put best brains like Rob on providing a number.
        AND
        Seize the opportunity to argue for no regrets policies.. like making nuclear easier to build.

      • “So, you better put best brains like Rob on providing a number”

        I’ll handle this.

        0

        Andrew

      • Either 0 or 0/0.

      • Zero is probably too certain, let me add some uncertainty: 0 +/-0.1

      • As far as I know nuclear is the only real solution to a reduction of CO2 output. Hansen sent out his letter but I haven’t heard anything since. It either fell on deaf ears or was ignored. The argument about CO2 seems to have come down to amount. I know the alarmists want to cast a wide net with the term deniers but I think even most skeptics see some attribution so that is mostly political posturing. In my view, and consensus keeps insisting, that part of the debate is over. So why haven’t they moved on? Obama is implimenting policies that try to punish carbon emitters but has only timidly suggested any real solutions such as nuclear. We all know why. Ever since Three mile island, China Syndrome and Chernobyl Big Green has been staunchly against nuclear and the old plants keep closing. Nuclear is antithetical to the very DNA of Big Green. The only way for that to change is for someone with enough cred, such as Hansen, to stand up and punch the bully in the mouth. Hansen seems to addled, timid, and more inclined to battle big carbon than big green. So we will continue to see feckless policy that never addresses directly the real issue.

        The policies being pursued, especially here in california, are designed to punish and will ultimately only lead to higher energy prices affecting productivity and the poor with big government being the only winner. I would be in favor of a gradual tax increase on carbon if I knew it meant there was a real solution in the form of nuclear, electric cars, and new technology in renewables. To me there lies the problem. I see this as simply a power grab with no realistic solution. It will ultimately end as another failed government boondoggle. I wish I could be optimistic but I’ve seen this happen too many times and see history repeating itself.

        Another problem I see is the emphasis always going in the direction of bigger is better. I’m not fundamentally opposed to big projects but it often comes with corrupt price tag. Reliance on the grid is simply the new monoply replacing the Rockefeller models of big oil; bribe the politicians and grease the wheels. A case in point is the big projects being proposed here in california. The Mojave solar plant was paid for by the government subsidizing BrightSource energy and they will recoup their investment with higher rates to the ratepayers. So, as usual, we get it on both ends. Screw the taxpayers and screw the ratepayers. Now there is two sides to this story. BrightSource is an Israelis company and did raise private investment and will have an IPO. One investor (Goggle) has dropped out of this market in favor of declining costs in photovoltaic.

        http://www.usatoday.com/story/news/nation/2013/11/10/bird-feathers-singed-solar-power/3491617/

        http://www.greentechmedia.com/articles/read/brightsource-energy-vs-la-times

  72. ‘DocMartyn | September 25, 2014 at 8:25 pm |

    Rob this must be wrong 1361.5 W/m2!

    It is closer to 1365.5 W/m2

    How could you be out by 4 W/m2? Thats more than a CO2 doubling.’

    Hi Doc – don’t blame me – they adjusted it down by 5W/m2 in 2011. It matters little – it is still hugely uncertain due to the absolute calibration issue. Only changes are reliable.

    see – http://judithcurry.com/2014/09/24/lewis-and-curry-climate-sensitivity-uncertainty/#comment-632671

  73. Mosher,

    How arrogant are his comment. He says:

    If your skeptical hunches play out you have a chance of eliminating the case for catastrophe.

    or you can stay outside the debate and cry about nobody wanting to debate you

    As he said long ago, he doesn’t understand impacts. He’s note even aware they are what’s important. Really, he’s stuck in his room with his computer and never been outside. Poor Mosher the relentlessly arrogant, condesending …

    • Peter

      Mosh was replying to me I think after I used the many arenas that represent the climate debate analogy. He seems to want to play only in the arena marked ‘climate science’ which by now is probably the least important arena.

      Moreover he is playing in a small room set within the arena marked ‘sensitivity’.

      Unfortunately the various players walk right past the locked door to a very big room marked ‘observations’ and cobwebs are growing in the corner.

      Everybody needs to get out more and step outside their very narrow area of expertise.

      tonyb

      • Good point.

        My reactions was over the top. but quite in tune with Mosher’s incessant belittling of others who don’t accept his beliefs and his attempts to try to make out he is THE authority.

      • As I’ve said before, I’d be surprised if the climate is so neatly sensitive. More like an Arsenal supporter with an infected tattoo, if you ask me. You might get one thing going on inside Arrhenius’ glass receptacles but quite another thing happening across a rather large planet. The great mass of that planet, mostly hot, might also give things a bit of a nudge along.

        Nothing one could model, of course. Just reality.

      • peter

        I like Mosh but he is a numbers man who deals only with equations, even if most of the numbers to work with are missing or highly debatable.

        In this current debate angels dancing on the heads of pins come to mind in as much the numbers being employed by both sides to prove their point are almost indistinguishable from the other.

        Does Co2 cause warming? Surely. Can it be distinguished from almost zero once you get above a certain concentration? Probably not. Has that concentration already been reached? Probably.

        Is natural variability far more important? Yes, on the evidence we have before us. Much of it locked away in that room marked ‘Observations.’

        tonyb

      • mosomoso

        Your reply was not there when I started typing. The key to the room marked ‘observations’ is hanging right next to the door in plain sight.

        Why don’t they open the door, get rid of the cobwebs and start looking at the racks piled high with observational material? Most of it is stacked quite neatly.
        tonyb

      • Tonyb,
        Thanks for the note and link up thread about Max.

        Always skim and look for some commentors and skip others. Yours and Max were good stopping places.

        Thanks for what you have done over the years.

        Thanks to Judy for running this blog. Georgia Tech will miss her leadership as chairperson.

        The climate controversy needs her and your contributions to science and rationale yet civil discussions.
        Scott

  74. Pingback: Climate Musings on a Messy Battlefield | climatecontrarian

  75. Mosh wrote:

    “the longer the pause goes the smaller
    the ECS becomes

    A longer pause means dT doesnt change.
    But dF ( change in forcing) goes up.
    dO can also go up if heat is stored.

    So. to narrow the range we need better measures of dO and better measures of dF. The uncertainty in dF is dominated by aerosols.

    If we believe that observationally based estimates are the best ( an assumption with uncertainty ) then we really should be
    A) resolve the uncertainty in aerosols.
    B) measure the ocean better.

    If we believe that paleo approaches are best ( an assumption with uncertainty) then we need to spend a lot more on Paleo work.

    If we believe that model based approaches are best, then we need to have our heads examined.”

    Not that my opinion matters, but I will agree this is an excellent comment.

    If we assume the warmist notion that global land ice is shrinking AND dO is increasing during the pause, then we should see sea level rising at an accelerating rate. As far as I know, that has not been the case over the past 15 years or so. So for now, I will assume that dO is not increasing or land ice is not decreasing, or both have very low delta rate at this time.

    It is scientific to assume that we do not know everything there is to know about dF. (Conversely, it is always anti-science to assume that we know everything about anything.) And certainly, the role of aerosols is a major known unknown, and thus a field which is ripe and hanging low for easy picking.

    On the other hand, mainstream climatologists are finally becoming more receptive to the idea that there is a “natural variability”. And a certain fraction will admit that there exist both cyclical and random-appearing components to this natural variability.

    Whenever I am trying to describe how a system works and I see lots of “random” variability I always assume that I am simply too ignorant to see a pattern, there are drivers which remain unknown to me, and much work remains to be done.

    In this case, I hope that we are on the verge of discovering (and admitting) that man-made drivers are small enough that we can temporarily put aside vastly expensive sociopolitical “fixes”, work towards elevating the third world to a prosperous zero population growth stage, and spend the next decade or so trying to understand how climate works in a rational setting that will reward wide-ranging and open-minded research.

    • Hear, hear, but this will only work if scientists are freed from the perverting consequences of the world’s focus on CO2.
      ==============

    • I hope that we are on the verge of discovering (and admitting) that man-made drivers are small enough that we can temporarily put aside vastly expensive sociopolitical “fixes”, work towards elevating the third world to a prosperous zero population growth stage, and spend the next decade or so trying to understand how climate works in a rational setting that will reward wide-ranging and open-minded research.

      +1

    • Good comment. My only quibble is that we in the West have the hubris to believe we can fix the problems of other nations. In many cases they don’t want our form of government and don’t share our cultural values. We should realize this after the failed efforts in Muslim countries.

      The problem isn’t that they don’t have money. The problem usually lies with corrupt governments that rule with absolute power. Unless you can change that, you won’t be able to change anything else. The second problem is that in some nations; cultural norms, educational levels, and religious beliefs work against the establishment of a prosperous society.

      Obviously, many of these third world countries possess abundant resources. China is a good example of a country that changed, although I’m not a fan of the government there – at least they are allowing some free enterprise.

      So, it’s an admirable thought, but until you can first change government then culture, it will probably be a losing battle. And a waste of money besides.

      • Jim2, I agree with your thoughtful quibble. Even within the US, those who would force social change through legislation or court activism must be mindful that some fellow citizens “don’t want our [proposed] form of government and don’t share our cultural values.”

        Because vision can be myopic, and because we begin most journeys without knowing every roadblock along the way, I attempted to qualify those last two difficult goals with “work towards” and “trying to”. As always, a balance of optimism, humility, pragmatism and flexibility is always needed to reach a useful solution to any significant problem.

    • We have a cure (decarbonisation) looking for justification that is simply not available from the evidence.

    • Sciguy54
      “Whenever I am trying to describe how a system works and I see lots of “random” variability I always assume that I am simply too ignorant to see a pattern, there are drivers which remain unknown to me, and much work remains to be done”.

      You are obviously well educated, highly intelligent and well aware of your abilities. Thank you for taking time to say carefully what many scientist’s obviously know.

    • the longer the pause goes the smaller the ECS becomes

      That might be true if knew that net shortwave was not changing very much.

      But we don’t know that.

  76. The paper may be useful in the policy debate, provided it doesn’t distract from an overiding need to improve observational and modeling/computer capabilities; improving these capabilities may require a concerted and coordinated effort with large investments.

    I’m confident that Dr Curry will be a supporter – and may be a leader – in the investment effort, and hope that other influential people will follow.

    • It’s useless to pour large sums of money into modeling if you don’t understand the system you are attempting to model. If there is going to be such an effort, there should be only one computer system and the cost shared among countries.

      It is far more cost effective to spend money on enhanced observation, both in quality and quantity. That’s where most of the money should go at this point in time. And here too, the cost should be shared among nations.

      • jim2 +1. There would be far better benefits to mankind if weather forecasting capability could be extended from 7-8 days to weeks. This would give vulnerable communities a better chance to adapt to adversity from climate change and sudden climate shifts.

      • +1, Peter. That IS something that would help third world countries and wouldn’t entail “regime change.” A big plus all around.

      • “spend money on enhanced observation”

        Haha. Why do this when you can post facto adjust to the right numbers?

        Andrew

      • Jim2 and Peter: Agree with you. Improved observation capability is the priority. And, in addition to quantity and quality there is a need, according to Koonin, for capabilities not yet developed. I added computer/modeling because Koonin described the inadequacy of current computer capacity for defining weather to necessary grid sizes.

  77. Stephen Segrest

    In “applied” chemistry & physics, is there anything that could explain “The Climate Pause”? For example, in designing aircraft or spacecraft, are there transitional pauses when some threshold is broken through that our engineers consider? Thanks.

    • The present day enthusiams for thinking about climate only in terms of CO2 leads propenents of CO2 primacy to consider only GHG RF.

      Chaotic flow of the atmosphere creates upredictable variations across a spectum of time scales, resulting in energy fluctuations, which can easily explain temperatures.

      Explain, but not predict.

  78. John Smith (it's my real name)

    since this thread has gotten a bit off climate sensitivity…
    I also appreciate Sciguy54’s good comment

    as Dr. Curry has said the the “pause” is at the heart of the issue, and also central to determining sensitivity

    also central to most of the comments above

    it is strange to me that few outside of CE blog world acknowledge that surface temps have been flat, lo these 17 years

    on SkS they go on an on with lots of graphs “proving” there is no “pause” and that warming continues
    (which comes across as pretzel logic to my ear)

    I doubt Ban Ki Moon or Barrack Obama have even heard of the “pause”

    yet, “someone” has produced 54 and counting explanations for “it”
    (“it” I guess being the failure of the models)

    as an outsider, this is one the most bizarre things I’ve ever seen

  79. One powerful figure plans to leave the “sinking ship!” ship: http://www.dcclothesline.com/2014/09/26/holder-staying-one-step-ahead-burning-bridge/

  80. The WWII re-enactors at Skeptical Science have woken up, and are gently dissing the paper, which has also been picked up by the Times:
    http://www.thetimes.co.uk/tto/environment/article4218212.ece?utm_source=Daily+Carbon+Briefing&utm_campaign=6444d5d673-DAILY_BRIEFING&utm_medium=email&utm_term=0_876aab4fd7-6444d5d673
    (paywall!)
    The fact they haven’t launched an all-out attack suggests they can’t see anything wrong with it.

    I’ve come to the conclusion that the paper acts as an excellent carrot, which when combined with the terrible example of Mann’s floundering to defend the indefensible (as the stick) may tempt some people to row back from some silly alarmist positions they’ve taken on global warming. Perhaps Koonin’s take on matters as in the recent WSJ article is a straw in the wind.

    I’ve written a full post on this on my blog (where visitors are never subject to crowding and you can help yourself to all the tumbleweed you can eat):
    http://jonathanabbott99.wordpress.com/2014/09/26/the-carrot-and-the-stick/

  81. Pingback: Study lowers range for future global warming, but does it matter?

  82. ‘Put your best brains – like Rob – on providing a number.’ the mad, naked Emperor Moshpit

    Thanks Moshpit. The point really is that sensitivity is dynamic – γ in Ghil’s zero dimensional energy balance model.

    http://watertechbyrie.files.wordpress.com/2014/06/unstable-ebm-fig-2-jpg1.jpg

    It is the change in temperature (ΔT) divided by the change in the control variable (Δμ) – the tangent to the curve as shown above. Sensitivity increases moving down the upper curve to the left towards the bifurcation and becomes arbitrarily large at the instability. The problem in a chaotic climate then becomes not one of quantifying climate sensitivity in a smoothly evolving climate but of predicting the onset of abrupt climate shifts and their implications for climate and society. The problem of abrupt climate change on multi-decadal scales is of the most immediate significance.

    The probabilities I assume are something like a log-Pearson type III probability distribution. A preponderance of low impact high probability outcomes and a long tail of high impact low probability events.

    https://watertechbyrie.files.wordpress.com/2014/06/log-pearson.png

    It is just the maths of probability – and extreme change – such as we have not seen in the 20th century will happen. It is not necessarily carbon dioxide related.

    To avoid repeating myself yet again – http://judithcurry.com/2014/09/21/an-unsettled-climate/#comment-632081

    Building resilience to climate variability that will happen regardless remains a central objective of rational policy. Economic development is the core of building long term resilience. Fast mitigation is not merely possible with reductions in population pressures and emissions of black carbon, tropospheric ozone, methane, CFC’s and nitrous oxide – but are outcomes of health, education and economic development strategies. We may also reduce carbon emissions by building soil fertility on agricultural lands and conserving and restoring ecosystems. There are practical and pragmatic approaches that provide real no regrets policy options.

  83. I’ve actually tried to Google this…so don’t attack me. 1850-present about 0.8 C. warming.

    What are the error bars on this? It seems ludicrous to think anyone knows within a whole number what the temperature was in 1850- let alone down to a decimal point.

    Can’t we all agree to agree that some modesty is needed amongst tax-funded scientists.

    It’s OK to let the monster out of the bag. (that’s what she said (not cool!) Not allowed to talk like that anymore) OK-MM still sucks.

  84. Curry and Lewis make it onto the front page of The Weekend Australian, Australia’s best newspaper. That’s an achievement worth celebrating!

    Carbon debate Ignites”
    Short intro pointing to main article on p3

    Climate not as sensitive to carbon dioxide

    “A NEW peer-reviewed paper using observations rather than computer models has found the Earth’s climate was less sensitive to increasing levels of carbon ­dioxide in the atmosphere than predicted by the Intergovernmental Panel on Climate Change.

    The findings have generated vigorous international debate about an issue that remains a key area of uncertainty in climate ­science.

    The paper, published in the journal Climate Dynamics, was prepared by US climate scientist Judith Curry and climate ­researcher Nic Lewis.

    Dr Curry said the sensitivity of climate to increasing concentrations of CO2 was at the heart of the scientific debate on anthropogenic climate change, and also the public debate on the appropriate policy response to increasing ­carbon dioxide in the atmosphere.

    She said climate sensitivity and estimates of its uncertainty were important to establishing the cost benefit of taking action to limit greenhouse gas emissions.

    The Lewis and Curry paper does not claim to be the last word on the subject and said the major area of uncertainty was the role played by aerosols.

    But the paper contains a much higher level of comfort than does the IPCC that the world will not exceed the two ­degrees warming threshold set by the UN.

    The Lewis and Curry paper said the best estimate for equilibrium climate sensitivity — the change in global mean surface temperature at equilibrium that is caused by a doubling of the ­atmospheric CO2 concentration — was 1.64 degrees.

    The temperature range given with a confidence level of 17 to 83 per cent was 1.25 to 2.45.

    This range compares with a range of 1.5 to 4.5 given in the IPCC’s fifth assessment report for the same level of confidence.

    Unlike the fourth assessment report, the IPCC’s most recent synthesis document did not give a best estimate for climate sensitivity. The Curry and Lewis paper’s best estimate for transient climate response — the temperature change at the time of CO2 doubling — was 1.33C with a range of 1.05C to 1.8C.

    The IPCC range was 1.0C to 2.5C with no best estimate given.

    The IPCC report acknowledges the scientific debate that continues over the issue of climate sensitivity and the different ­results between models and analysis based on observations.

    To arrive at their lower climate sensitivity range than the IPCC, Lewis and Curry analysed the Earth’s observed temperature change, ocean heat uptake and the level of human greenhouse gas emissions and natural ­variability.

    By contrasting the period 1859-82 with the period 1995- 2011 they estimated how much the Earth had warmed in association with human greenhouse gas emissions. Neither the Australian ­Science Media Centre nor the University of NSW Centre of ­Excellence Climate System Science commented on the Curry and Lewis paper yesterday.

    Dr Curry said the paper was not the last word of climate sensitivity because it related only to the uncertainty in external forcing, surface temperature and ocean heat uptake.

    It did not take account of solar influence or ­internal variability.

    In an essay published this week, President Barack Obama’s former climate advisor Steven Koonin said today’s best estimate of the sensitivity was no different, and no more certain, than it was 30 years ago despite billions of dollars having been spent.

    The Australian’s Environment editor seems to have got the message on “uncertainty

    I wonder if uncertainty could become the in-word grant applicants have to use in their grant applications to get funding in future as “sustainable”, “climate change” and the other buzz words demanded by grant judges become out of date.

  85. Pingback: Under 2 grader - Stockholmsinitiativet - Klimatupplysningen

  86. Judith I have a rather direct question for you. You say this method assumes no role for internal variabilty on the ~century scale of this study and you have stated that internal variability does play a role on this scale. Does this mean you don’t actually believe in these sensitivity estimates?

    It’s easy for me to see that science allows one to ask what if question and make assumption, even one’s you don’t believe to be true, in order to investigate specific question. But I’m interested in hearing how you might explain publishing estimates you might not believe are meaningful.

    • As described in the meta-uncertainty thread, it is not clear how to interpret or calculate ‘climate sensitivity’. that said, climate sensitivity is arguably the most single important parameter used in economic cost benefit models and the social cost of carbon. So it is important to clarify the uncertainties in this parameter, even if i am concerned in a meta sense that this parameter may not be very meaningful scientifically

      • “social cost of carbon.”

        Am I being persnickety….or worse misinformed….when I object to the word “carbon” with all its negative connotations. Aren’t we talking about Co2,..the stuff without which life would as far as I know…not exist?

    • ” So it is important to clarify the uncertainties in this parameter, even if i am concerned in a meta sense that this parameter may not be very meaningful scientifically.”

      And there is the rub in the climate debate. That which “may not be very meaningful scientifically” is passed off as the settled scientific consensus, as grounds for massive policy shifts.

      The real reason it is “important to clarify the uncertainties in this parameter” is precisely to prevent its use in the policy debate.

  87. Hello all. I’m trying to educate myself on climate science and came across this interesting blog and read this equally interesting paper. It’s a good effort to try to better quantify the uncertainties although its clear more work needs to be done.

    I have a question/concern about the calculations: The authors write (my words here of course) in section 3 that the (modelled) ocean heat uptake is scaled by 60% to better fit the model ECR with that arrived in the study. But isn’t the model results used to compute ECR? This scaling then seems rather strange to me, have I misunderstood the paper?

    • No, the model result is only used to estimate ocean heat uptake in the base period, which is before observational data was available. The estimate of ECS is not particularly sensitive to the scaling used, and the TCR estimate is completely unaffected by it.

      • Thank you for the reply, that is actually how I read the paper (I understand you only model where you have to), I should have been more clear in my question. If it’s only a small effect I suppose it doesn’t matter, but I’m not sure I would have scaled anything unless I knew the ocean heat uptake was where the model erred. That the model fails of course puts you in a bad spot regardless. Anyway thank you for a good read and good luck with future publications

  88. Pingback: Weekly Climate and Energy News Roundup #151 | Watts Up With That?

  89. Pingback: Notes FromTPPF’s Climate and Energy Summit | Somewhat Reasonable

  90. Pingback: blognetnews » Abschätzung der globalen Erwärmung durch CO2 und solaren Einfluss

  91. Pingback: Bendy Boundaries | Skeptical Swedish Scientists

  92. Pingback: An important paper on climate sensitivity « DON AITKIN

  93. Ross McKitrick just published this paper clearly explaining the policy implications of overestimating ECS and TCR. It includes a great explanation of the “fat tail” and pretty well debunks it.

    http://www.fraserinstitute.org/uploadedFiles/fraser-ca/Content/research-news/research/publications/climate-policy-implications-of-the-hiatus-in-global-warming.pdf

    • thx for the link

    • He reiterates his idea of a revenue neutral carbon tax starting at a moderate rate but linked to temperature rises. I agree, except that instead of the tropical troposphere, I would use the global surface temperature, and probably decadal averages. This is putting your money where your mouth is, and he does that. Many skeptics dislike the idea because they are less sure that the temperature rise won’t resume. He even says that a futures market will allow people to really make money from good predictions and that it guides investors towards being more honest in their assessments.

      • No – it is still a pointless and unworkable distraction form the real problems of the world. There is no such either as a revenue neutral carbon tax. It either isn’t sufficient to result in substitution or it is and there are higher prices and no tax revenue. I know – let’s vote on it. That would be putting it to the democratic process.

  94. Pingback: Climate Sensitivity Uncertainty

  95. Pingback: Modern Science Refutes Global Warming Alarmism | Atlas Monitor